Archive for the ‘Economics & Markets’ Category
The GameStop Story
Posted on: January 31, 2021
Before I tell the story, let’s get a few concepts clear.
Short Sell (short) means selling shares you don’t actually own. Instead, you borrow them from the brokerage to sell, but you have to buy them back at some point in the future, hopefully at a lower price, to pay back the brokerage shares you owe. To guarantee that you have the money to buy back shares you owe at all times, the brokerage requires you to have a maintenance margin of 130% of the value of the shorted shares to keep the position open. If you fall under the margin requirement, you will get a margin call to post additional money. Should you fail that, the brokerage will close your positions. This is done by buying shorted shares in the market using your money in the margin account. This forced action can cause a short squeeze. I will give you the definition with an actual example of GameStop (GME).
Just two weeks ago, GME was being traded at around $20. Some big hedge funds like Melvin Capital (Melvin), thought it should be worth only $5, so they began to short the stock. At one point, the short interest ratio, the number of shorted shares relative to the number of outstanding shares, was 140%. Since GME has about 70 million shares outstanding, Melvin shorted nearly 100 million shares of GME. Apparently, a portion of those shares was borrowed and sold twice.
Read the rest of this entry »Share this:

In July of 2007, I attended a special send-off party for then Fed vice-chair Larry Meyer. As part of the program, we all listened to him spill his thoughts about the economy at the time. You can read my note titled “Larry Meyer: Diminishing Risks …” here.
He essentially saw the risk of a recession diminishing. When asked when he thought the next recession would be, his answer was “not within in the next two years.”
Shortly after his talk, the subprime mortgage company, Countrywide Financial, collapsed. Seven months later, Bear Stearns collapsed, followed in a few months by Lehman Brothers. By the end of 2008, we were already in the depths of the worst recession since the Great Depression. Larry Meyer surely did not see that coming!
Read the rest of this entry »Share this:

Some of you know that I went back to school in 2019. Specifically, I was accepted into the EMBA program at Oxford University Said Business School. The program was interrupted by the pandemic in April when I still had about a quarter of classes to finish, so I postponed it for a year. Now 2020 is coming to a close and the Dow has recovered all its losses. It’s a good time to reflect on how my studies there changed the way I invest.
The most important thing I learned is about how central banking works, specifically how money is created. I came to understand that terms like “central bank balance sheet expansion”, “central bank asset purchases”, “quantitative easing” all mean one thing: printing money. I also came to understand that the amount of money the Fed releases into the economy to a large extent really determines asset prices. This understanding helped me make the right call during the stock market panic in March and April.
Read the rest of this entry »Share this:

Don’t Fight The Fed!
Posted on: August 6, 2020

There are three major factors that drive the stock market: economic fundamentals, investor sentiment and the Fed. Lately the Fed’s role has become more and more prominent. It’s thus very important to be able to read Fed’s moves correctly. For instance, what does it mean when The Wall Street Journal reports “Fed Weighs Abandoning Pre-Emptive Moves to Curb Inflation.”
Let me show you how I read the Fed’s moves since the onset of the Pandemic …
On March 13th, as the Pandemic was picking up in the US, the Fed announced a $1.5T injection into the market. This prompted my newsletter article “What Fed’s $1.5T Injection Means For The Market” when I wrote:
There are only three buckets into which this money “water” can go: 1) goods, 2) services and 3) assets. Do you think that over the next few months, we the people will consume more goods and services? Apparently not since we will all be hunkering down in our basements. The only place the new money can go is to purchase assets, meaning stocks, bonds, and real estate.
Share this:

 In my last article, I wrote that the Fed’s actions were necessary to backstop the economy from sliding into another Great Depression. Now let’s talk about a few of the negative long-term consequences.
Hyperinflation
With so much liquidity sloshing around in the economy that is only half-opened, the only outlet is the financial market. That’s why we’ve seen a divergence of the financial market and the real economy. These two will have to converge at some point. When this happens, will we see hyperinflation? That is, the prices of goods and services are rising fast like they do for assets. In its communication, the Fed has signaled to the world that they don’t foresee any inflation in the next two years. If you read between the lines, it appears that the Fed does not see the economy returning to normal in the next two years, and during this time, they may print still more money.
Share this:

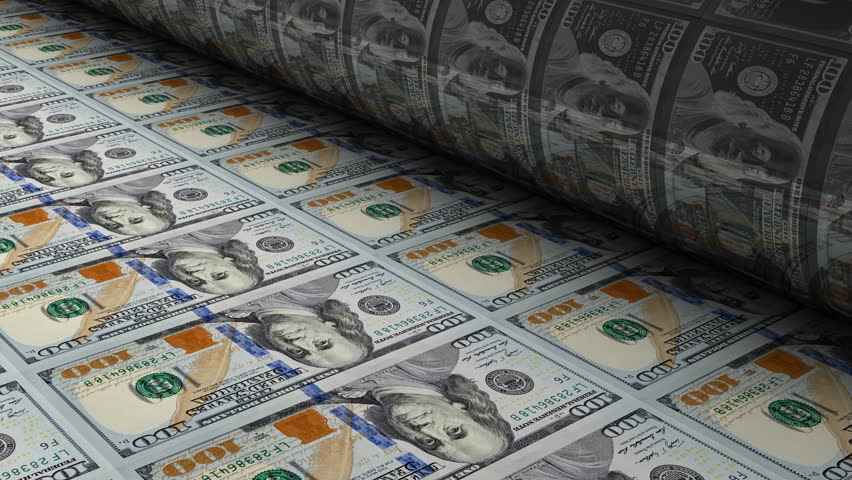
 “Since the beginning of March, the Fed’s balance sheet has expanded by just over $3 trillion, with the bulk of it from central bank purchases of Treasuries and agency mortgage-backed securities.” This is a quote from a MarketWatch news piece titled “Fed’s Daly Defends $3 trillion in Asset Purchases …”
After my last newsletter article, you should understand that balance sheet expansion is just an economic jargon of money creation. Today I am going to give you three reasons why the Fed needed to “print” money to prevent a Great Depression scenario.
Share this:

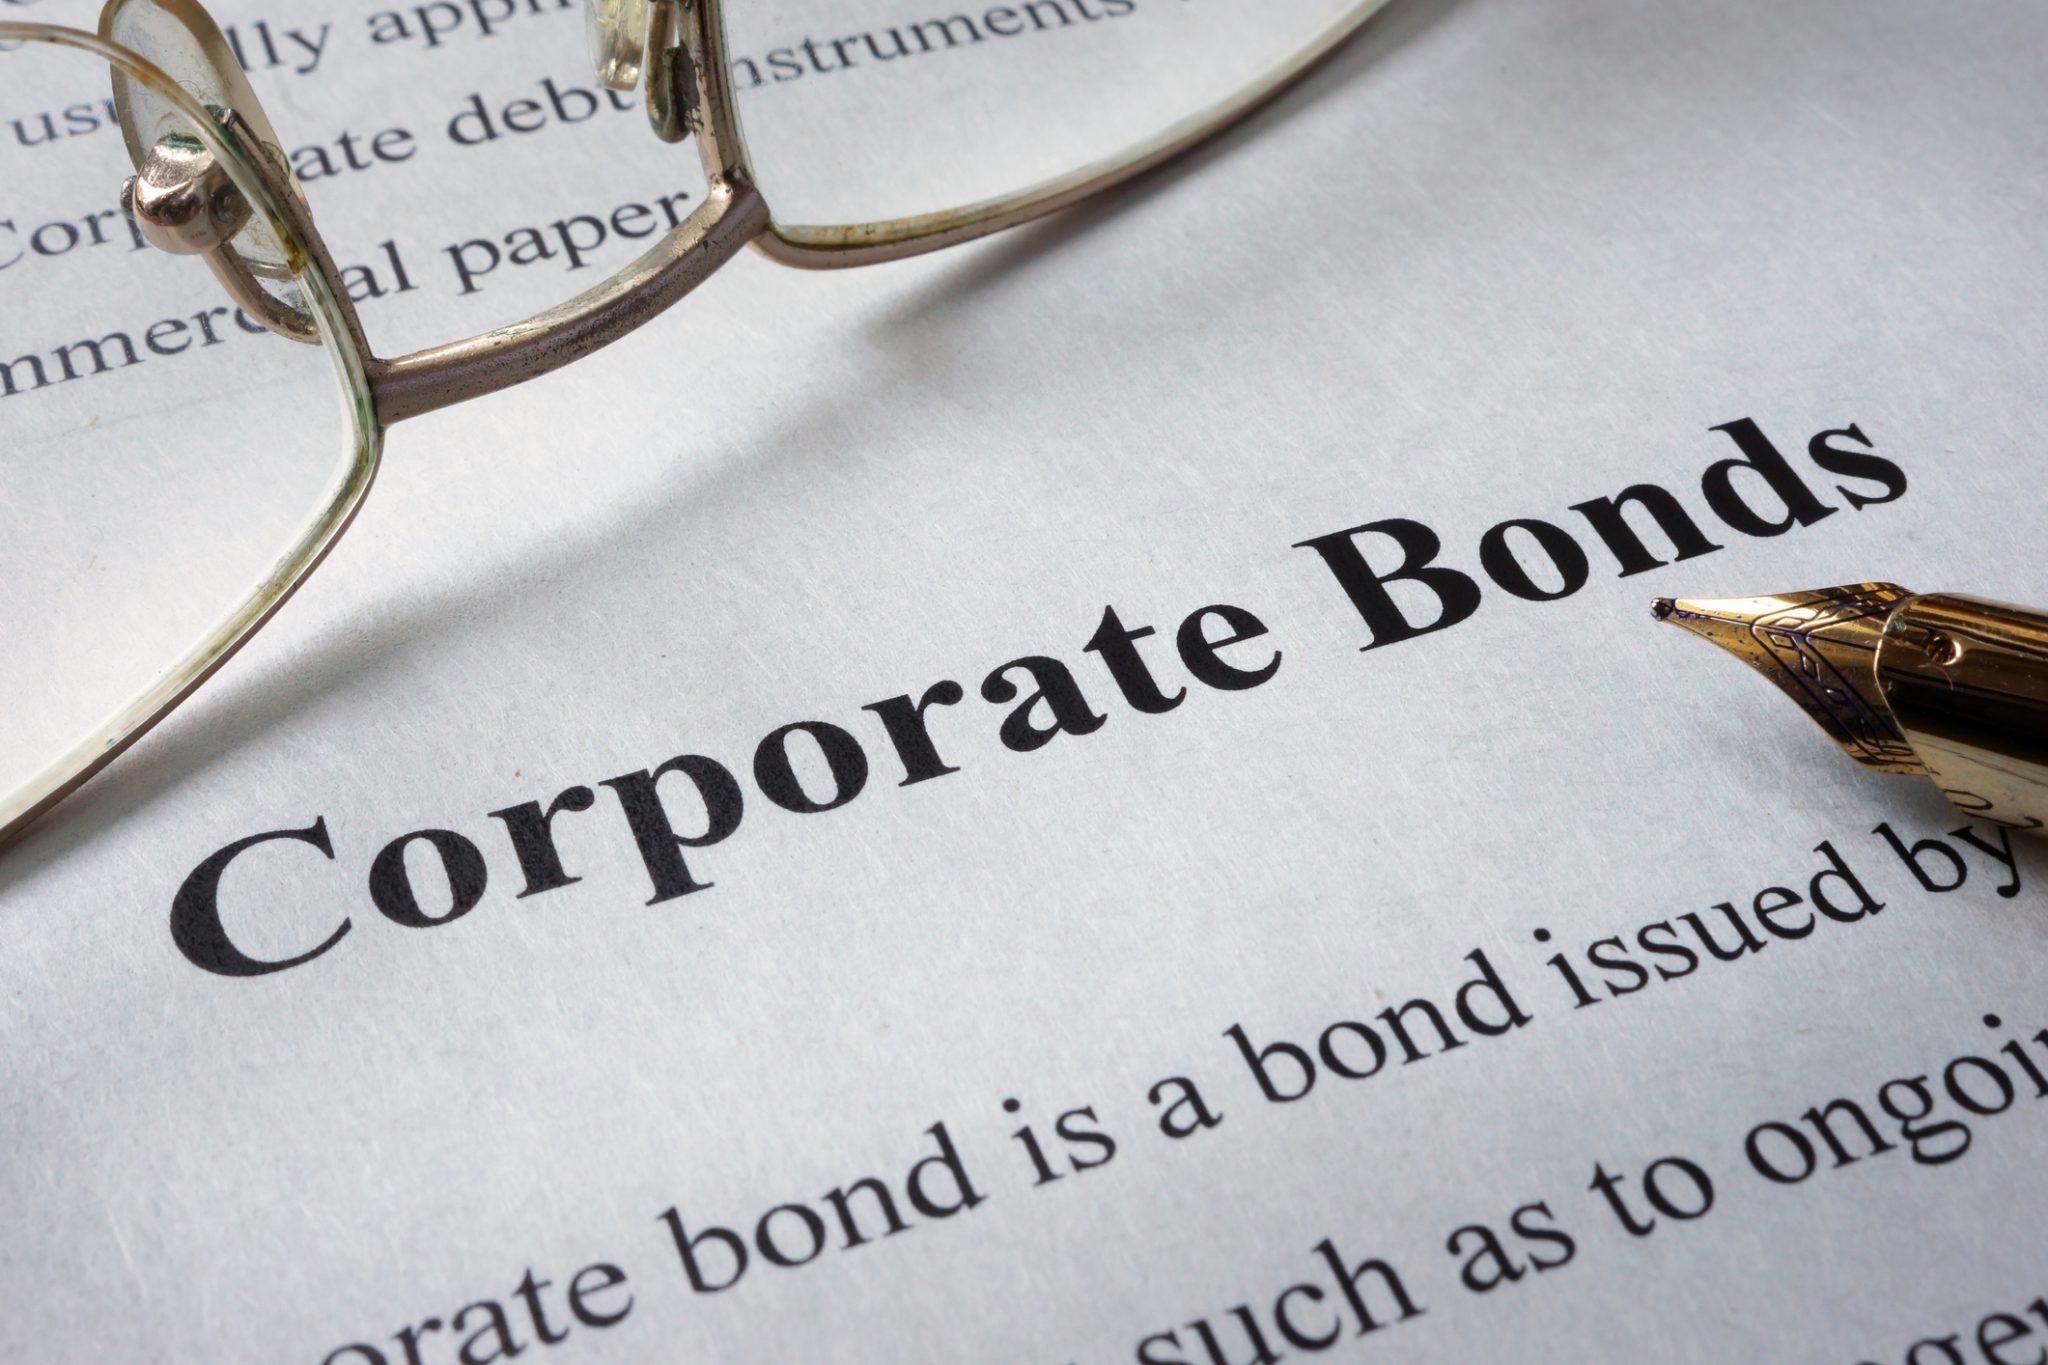 Three days ago, the Fed announced that they will go directly to the corporate bond market to purchase $250 billion worth of investment-grade corporate bonds. A few of my newsletter readers asked me to comment on this, so here I am.
Basically, the Fed buying $250 billion of any securities can be seen as the Fed creating $250 billion of new money and injecting it into the economy. It really doesn’t matter whether these securities are treasury bonds, munis or corporate bonds. Munis are bonds issued by states.
So how does the Fed create new money?
The classical monetary theory posits that paper money must be backed by something valuable. Since 1974, the US dollar has no longer been backed by gold. For a long time (until 2008) it was backed by US treasuries. The Fed has a balance sheet. Let’s say by 2008, the economy needed $3 trillion to function. The Fed would create $3 trillion out of thin air and use the money to buy $3 trillion worth of treasuries. The Fed balance sheet would look like this : on the assets side, it shows $3 trillion of US treasuries, on the liabilities side, $3 trillion issued. Now the money is no longer considered to be out of thin air, since it is backed by treasuries that carry the explicit guarantee of the US federal government.
Share this:

 In my economics class at Oxford, I learned a very important concept: technology by and large manifests diminishing returns to scale.
When economists use the term “technology”, they usually mean the method of production, that is, taking labor and capital as inputs, and outputting something valuable. For instance, there is a method by which I deliver my financial advisory service, economists would call that technology. It’s a catch-all term.
Diminishing returns to scale simply mean the bigger you are, the harder it is to make money at the same rate. Take my little practice as an example. It’s just me and my assistant. It can’t be smaller, but it’s super efficient. If we were a 20 person firm, I can’t imagine how I would manage all these people who all have their different agendas and motivations. The firm may make more money in the absolute term, but on a per head basis, it wouldn’t be as profitable as my little practice. That’s the essence of diminishing returns to scale.
Share this:

The Premium
The small cap value premium is a Nobel Prize-winning discovery about the stock market by Eugene Fama and Kenneth French. (Only Fama was awarded the Nobel Prize in 2013.) The original paper “The Cross-Section of Stock Returns” was published in the Journal of Finance in 1992. Using stock market data from 1963 to 1990, Fama and French found that small cap stocks outperform large cap stocks (small cap premium) and value stocks outperform growth stocks (large cap premium). Collectively, they are referred to as the small cap value premium.
Since the paper was published, many researchers have done out-of-sample studies and they found that this market feature persists in the data from 1928 to 1963, in the data from 1990 to as late as 2010, and even in foreign stock markets. So in academic jargon, this is a very robust feature of the market. (See chart below.)
Share this:

 Today the Oxford University Business School arranged a webinar in which my macro-economics professor, Oren Sussman, explained to us the economic impact of the Coronavirus. I will summarize the key takeaways below.
The capitalist system is characterized by periodic crises. The last one was the 2007 housing crisis. Even without the Coronavirus outbreak, we were on borrowed time. The long expansion since the last crisis was very much fueled by easy money from the Fed and imprudent fiscal policy from the federal government. As a result, the whole economy is overly leveraged (that is to say, having too much debt.) An economy without too much debt is like a pond of water. A stone thrown at it will create ripples that will eventually dissipate. An economy with too much debt is like a pane of glass. A stone thrown at it can break the whole thing. Prior to the Coronavirus outbreak, our economy was already like a pane of glass. Read the rest of this entry »
Share this:

 Let me start with my usual disclaimer that I can not predict the market. Like the similar article I wrote four weeks ago, this article is simply an exercise in which I think through possible scenarios for the market.
When I wrote “Will The Stock Market Give Us a 30% Discount?” the market had already fallen 19%, and I was thinking through the scenarios under which it would fall through 30%. One of the scenarios unfortunately came true: some US states have lost control of the Coronavirus situation, and the market did drop all the way to 36% before recovering to 23% down as it stands now.
Now with Europe finally turning the corner and the rapid spread in the US beginning to decelerate, will the market discount disappear quickly or will there be more shoes to drop that could cause the market to give us even deeper discounts? Could it hit 40% or more?
Share this:

 Prior to the market’s open yesterday, the Fed announced unlimited asset purchases that also include corporate bonds, municipal bonds and securities backed by consumer loans.
Wow!
There is a long-term downside of taking this measure. I am not going to write about it until the market calms down. Today I am going to write about the short-term upside for the economy, for the market and for investors like us.
Whether it is called QE (quantitative easing), asset purchases, or balance sheet expansion, it means the same thing: the Fed is creating new money. Just ten days ago, the Fed announced they would create $1.5T new money, but the market pretty much ignored that. Now the Fed is essentially saying that they will create as much money as possible to back-stop this financial crisis.
Share this:

 Yesterday, what got lost in the panic selling was the Federal Reserve’s announcement that $1.5T will be injected into the banking system.
Nowadays, money is created not through Treasury’s printing press, but through the Fed’s central bank balance sheet expansion. I won’t bore you with the mechanism. Suffice to say that yesterday, $1.5T of new money was created, and this new money has to go somewhere.
Share this:

- In: Economics & Markets
- Comments Off on Is Another Financial Crisis Imminent?
How a financial crisis comes about? I am gonna use a simple styled example to illustrate the key elements that lead to a financial crisis: easy credit, leverage, contagion, shock amplification.
ABC Shipping has 100 vessels. The market value of a vessel is normalized to 1. (You can imagine that as 1 million dollars.) Because of easy credit (low-interest rates,) the company uses debt financing to the fullest extent. Banks demand a loan-to-value ratio of no more than 60%, so ABC Shipping borrows 60, and has its own capital of 40.
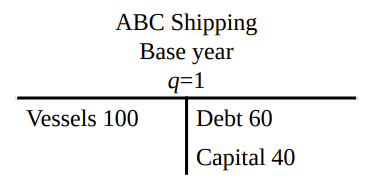
Now imagine, ABC Shipping is doing well operationally speaking, but the industry is Read the rest of this entry »
Share this:

Why was the Great Depression so bad? Are we likely to experience something like that in our lifetimes?
This month and next, I plan to write a series of articles about financial crisis. The ideas for this series will come from my Oxford University economics class. The class was taught by Professor Oren Sussman, a prominent scholar on the subject of financial crises. My aim is to explain concurrent economic policies, as well as to answer important questions like those posted above.
Irving Fisher (1867 – 1947) was an American economist who had a very simple theory about the great depression, and who inspired many post-Keynesian economists in later years. He observed that the prices of all things tumbled during the great depression, 43% to be exact, and that had a devastating impact on firms. See a stylized example of a surviving firm below.
Irving Fisher’s debt-deflation theory of the great depression
The firm had $100 in assets on its balance sheet. On the liability side, it had $50 in debt so its capital or owners’ equity was $50. Once the gross price level P fell by 43%, the firm’s assets were reduced to 57, its debt remained at $50, thus its capital or the owners’ equity dwindled to only $7. That’s a devastating 86% loss. The simple example isn’t just an unrealistic example. During the Great Depression, the S&P 500 actually did fall by 87%!
Share this:

For the final article of this macroeconomics series, I want to write about something that is much more relevant to your financial wellbeing, whether you are a wage earner or business owner. That is, what would happen if the dollar loses its status as the predominant reserve currency?
The Quantity Theory of Money states:
M/P = kY where
M is the total money supply, P is the gross price level, and kY can be interpreted as the demand for money.
If the dollar loses its “gold” status, central banks around the world will need much fewer dollars and the demand kY for the dollar will drop. To balance this out, either the gross price level P will increase, or the total money supply M will have to be reduced. To put it in layman’s terms, we will get hyper inflation and hyper interest rates, the latter to reduce the money supply.
Let’s look at a historical precedence. See the chart below

