Archive for the ‘Stock Market’ Category

A client of mine asked me this question and I thought many of my readers might have the same question.
What Happened to the Dot-com Bubble?
When the dot-com bubble popped in March of 2000, the Nasdaq lost nearly 80% of its value over a two-year bear market stretch, and it took 15 years, that is, until 2015, for the Nasdaq to regain its previous high. As you can imagine, that was financially devastating for investors fully invested in the Nasdaq.
Are We in a Similar Bubble, Only Now Driven by AI?
It’s highly likely. As I write now, NVDIA’s market cap is over $5T. In other words, a company with + 36,000 employees is now valued higher than the entire GDP of Japan, an advanced country with a population of 140 million. If that’s not a sign of a bubble, what is?
Will It Pop Like the Dot-com Bubble and Wipe Out 80% of Its Value?
Read the rest of this entry »Share this:

How to Deal With Big Market Drops
Posted on: April 7, 2025
Since April 2nd, the S&P 500 has dropped by 10.5%; and since its recent peak on February 19, it has fallen by 18.4%. How should we react to such significant market drops?
To answer this question, I want you to imagine that you bought all your clothes from Neiman Marcus and they are hanging (or sitting) in your wardrobe. Now imagine that Neiman Marcus announces an across-the-board 30% discount on all of their clothing items. Would you say “Damn, my clothes are now worthless” and sell them all at a flea market? You probably wouldn’t and might even make a trip to Neiman Marcus to buy a piece or two to add to your wardrobe.
Read the rest of this entry »Share this:
US Elections and Stock Returns
Posted on: November 3, 2024
Some readers of my newsletter asked me how to position their investments for the upcoming election.
I did a survey of academic journals on this topic, however there are basically no research papers available. There is an article published in the Journal of Financial Analysis, but this journal is not considered a top-tier academic journal. The lack of research could either mean that this topic is not viewed as a serious academic topic, or that there is simply not enough data to establish any validity.
I then went on to research industrial publications and found an interesting chart to show to you, my readers, that will drive home an important point that is dear to me, specifically, that you shouldn’t try to outsmart the market based on presidential politics.
See the chart below, during the Trump administration, renewal energy stocks outperformed traditional energy stocks by 43%; during the Biden administration, renewal energy stocks underperformed traditional energy stocks by 53%. If you had picked stocks based on presidential preferences, you would have been screwed left and right, literally.
Read the rest of this entry »Share this:

Last week I published a newsletter article titled “Will The Stock Market Return to The Fundamental?” I have received a good number of responses, and as promised, today I will share my thoughts.
The traditional economic theory has always presumed that economic actors are calculating and rational. The application of this presumption in the investment field is the efficient market hypothesis, which basically says that investors rationally pay the prices for expected future earnings adjusted for risk. The biggest proponent of the efficient market hypothesis is Nobel Prize winner Eugene Fama.
The efficient market hypothesis has its biggest opponent in Robert Shiller, who years ago published his seminal work that illustrated how a 1% change in dividends can oftentimes result in a 15% change in the stock price. If investors are, in fact, calculating and rational, stock prices shouldn’t fluctuate so much relative to dividends.
Read the rest of this entry »Share this:


The title of this article comes from a recent discussion I had with a client of mine. First, we should define what “the fundamental” means. It is best defined in Intelligent Investor, a book by Warren Buffet’s teacher Benjamin Graham. In short, his idea of a good investment is a stock with good earnings selling at a cheap price.
Graham’s insights were lately confirmed by Eugene Fama’s Nobel Prize-winning research, where Fama found that throughout history (until maybe 2015,) small-cap value stocks performed the best.
At present, the stock market in the US is definitely not following Ben Graham’s fundamentals. 70% of all returns are concentrated in the seven biggest tech stocks, all of which are very expensive. Nvidia for example, has a $3T valuation, which is 4 times the GDP of Taiwan, where its AI chips are made.
Read the rest of this entry »Share this:

I asked you all this question yesterday, and today I will share select replies followed by my comments on the matter.
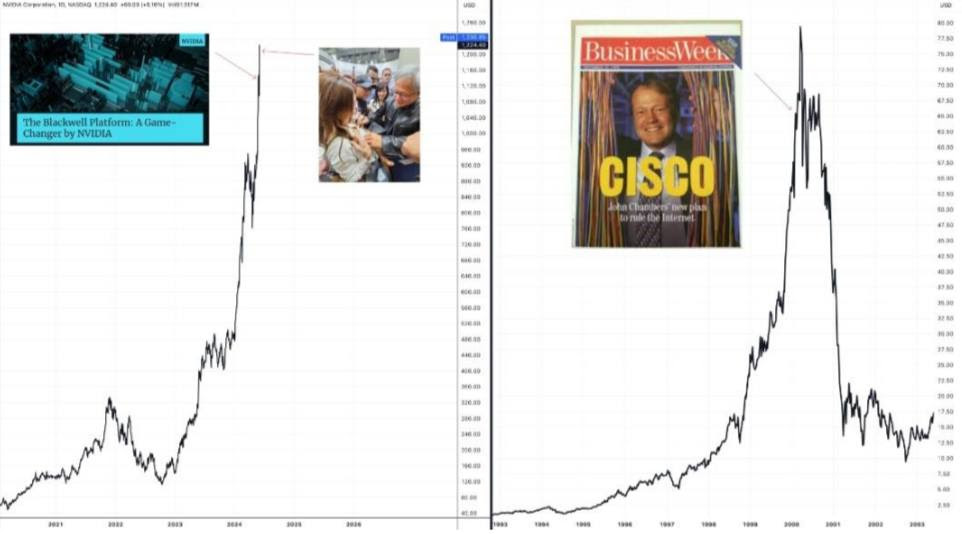
JG wrote: The joy ride will eventually end. The current price dictates an annual revenue growth of 10 percent per year for the next 100 years. This isn’t happening. Ultimately, the dream will fade, and many will lose their money.
JG also shared the chart below. What CSCO was for the internet age, NVDA is for the AI age, namely, an infrastructure provider. This picture is indeed worth a thousand words.
Share this:

Should We Buy NVIDIA Stock?
Posted on: June 23, 2024

In the last few days, I have gotten a few client calls about this. On top of that, my teenage son asked me the same question, telling me a classmate of his had bought this stock and made a few thousand dollars. Instead of answering this question outright, I’d like to hear your views. Please reply to this email, tell me what you think and give me your explanation.
In the next email, I will share with you not only my thoughts but also give you a summary of how you, my newsletter subscribers, responded.
Get informed about wealth building, sign up for The Investment Scientist newsletter
Share this:

This is an article I wrote fourteen years ago that was inspired by Daniel Kahneman’s Nobel Lecture “Maps of Bounded Rationality.” Here I will repost it without changing one word – I am proud of the evergreen nature of my articles. At the end, I will make a few additional comments in red that include new insights from the last fourteen years.
Do you know that the top three one-day drops in Dow Jones happened in October? On the 19th of October 1987, Dow Jones fell nearly 23%, making the day the worst day in the US stock market history. It was followed by the 24th and 29th of October 1929, when Dow Jones fell 13.5% and 11.5% respectively, ushering in the Great Depression. These events are commonly remembered as the crash of 29 and the crash of 87.
Read the rest of this entry »Share this:

Let me first define the term “small cap value premium.” It’s an observation (and indeed historical fact up until about five years ago) that small cap value stocks outperform large cap growth stocks in a rather consistent manner.
In academia, there are two theories attempting to explain it: 1) risk-based and 2) behavior-based.
The risk-based theory was pioneered by Nobel winner Eugene Fama, who argued that small cap value stocks are inherently riskier than large cap growth stocks, thus they deserve higher returns to compensate for higher risks.
Read the rest of this entry »Share this:

My long-term readers will remember that since I started writing investment missives, I have always advocated small-cap value investing. That is, holding a broadly diversified portfolio but with a weighting tilt towards small-cap value stocks.
Up until 2014, the historical evidence is overwhelming. Literally, since there have been stock market data, looking at rolling ten-year periods (see chart below,) there have been only two ten-year periods when small-cap value stocks under-performed large-cap growth stocks, ending in 1998 and 1999 respectively. These ten-year periods corresponded to the dot-com tech-stock bubble in the US.
Read the rest of this entry »Share this:

In June of 2007, I wrote my first article on stock market seasonality. There I wrote that there was a rather persistent and robust stock market phenomenon that the market tended to perform well in the winter months than in the summer month. By “persistent” I meant that it lasted for decades in the US market, by “robust” I meant that the phenomenon showed up in other stock markets as well, as can be seen by this chart.

Share this:


I started writing the Investment Scientist newsletter in May of 2007, and I think it would be fun to review my old articles. First of all to see if I was right back then, and if I wasn’t completely right, to see what I would write differently with the benefit of hindsight.
In May, 2007, I wrote three articles. In the first one, “The Unbearable Lightness of Chinese Stocks,” I made the statement that there was a huge bubble in the Chinese equity market and investors should stay away. In fact during that time, many (American) clients wanted me to invest in Chinese stocks, so much so that they said the reason they signed up with me was they thought I would help them do that. At the time I wrote it, the Shanghai Stock Exchange Composite (SSEC) just passed 4000, now it stands at 3412. After 15 years, it is still 15% below the level at the time. I lost a few clients for steering their money away from Chinese stocks, but in retrospect, I am glad that I made the right call.
Share this:

Buying Strong Stocks On Sale
Posted on: March 25, 2020
Now that the panic has abated a little, many financial advisors (FAs) are advising their clients to buy strong stocks on sale. None other than Jim Cramer made the same proclamation, he even mentioned ten stocks by name. (Just FYI, he did the same in 2008 – and I did a study afterward – 8 out of the 10 underperformed the S&P 500 index that year.)
So what are the strong stocks to own? Are they industrial titans like Boeing or GE? They were strong stocks but are they still? Are they Wall Street banks too big to fail like JP Morgan or Citibank? But how do we know they’re not just another Lehman Brothers? Is it a consumer tech giant like Apple? How can we be sure it won’t go the way of Sony, which was the previous consumer tech giant. How about Netflix? When we are stuck at home social distancing, you’ve got to watch Netflix right? But what if Amazon, Apple and the other big boys jumping in the streaming market eat its lunch?
Share this:

What Kills Investment Returns?
Posted on: November 23, 2019
Last week’s newsletter article “Why It’s Awesome To Have a Loser in Your Portfolio” has proven to be quite controversial. More than a few of my readers emailed me to warn that my Finance professor at Oxford was full of bullshit. Let’s put that aside for now, and consider this question:
If there is an investment that has an average return of 25%, would you invest in it?
If you did not jump in right away, you are a smart investor! Investment A falls 50% in one year and gains 100% the next, giving it exactly a 25% average return. If you invest $1000, however, you make absolutely $0 on this investment. On the other hand, investment B gains 25% in both years, so it also has exactly a 25% average return, but now the gain from $1000 investment is $562.5. You can not pick an investment in isolation of its volatility. Because …
Share this:

Don’t take my word for it, this was covered in my Finance class at Oxford. Let me see if I can get the gist across with a few graphs.
The graph below shows the risk/return profiles of a continuum of two stock portfolios of Coca-Cola and Intel. The vertical axis represents the expected return, and the horizontal axis represents volatility risk.
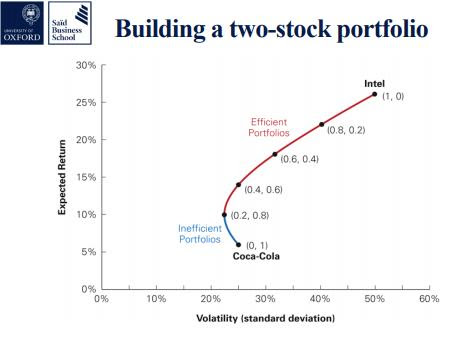
As you can see, Coca-Cola by itself is a low risk – low return stock, while Intel by itself is a high risk – high return stock. By using different weighting in the two stock portfolios, we can create different risk return trade-offs, represented by the curve. Read the rest of this entry »
Share this:

 As of the market close on Monday, December 17th, both the Dow and the S&P 500 have a 14% discount, the Nasdaq has a 18% discount and the small cap Russell 2000 index has a 22% discount.
On the Asian front, the Chinese market has a 27% discount, the Hong Kong market has a 22% discount, and the Japanese market has a 12% discount.
On the European front, the German market has a 21% discount, the UK market has a 14% discount, and the French market has a 15% discount.
According to my wardrobe theory of investment, this is a good time to buy stocks. If you were excited about buying stocks a few months back (when these markets were raising prices to new highs), you should be even more excited now!
(Feel free to share if you find it insightful.)
Schedule a Discovery review with me, or get my white paper for free: The Informed Investor: 5 Key Concepts for Financial Success.
Get informed about wealth building, sign up for The Investment Scientist newsletter

