Archive for the ‘Economics & Markets’ Category
Is The Dollar The New Gold?
Posted on: August 2, 2019
“Why are so many countries lending to the US for negative real interest?” Professor Sussman opened the floor for debate at our Oxford macroeconomics class. In totality, foreign countries own $6.2T of US debt. The chart below shows the countries that lend to the US.
In the previous three articles, I wrote about The Gold Standard, The Fiat Money andThe National Saving Shortage respectively. I hope I explained that the trade deficit is recycling of foreign savings for US private investments. And as long as we are paying negative real interest on our national debt, It’s not a problem, but a win to be able to keep borrowing. What I did not explain is why foreign countries would lend to us at negative real interest, and this is exactly what the professor asked in class and what I hope to explain with this article.
Share this:

The National Saving Shortage
Posted on: July 26, 2019
In macroeconomics, there is the balance of payments (BOP) identity …
Imports – Exports = Investments – Savings
This formula is called an identity, not a theory, because it is as true as 1+1=2. The identity basically says if a country imports more than it exports, that is, having a trade deficit, it is because the country does not have enough savings for its investments. (The chart below shows the saving rate of the US in the last few years.) The intuition is this. Foreign countries only have two ways to spend the money they earned from exporting to us, they can either buy our products, or they can lend the money to us. If we have a national saving shortage, we need them to lend us the money, not buy our products. This creates a trade deficit.
Share this:

The Fiat Money
Posted on: July 19, 2019
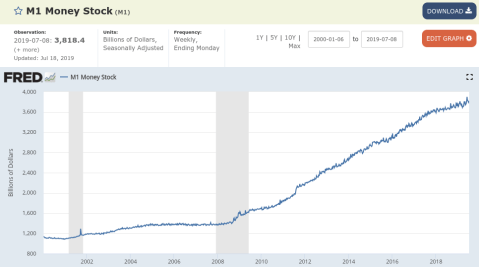
On August 15th, 1971, President Nixon announced that the US would no longer redeem US dollars for gold, thus formally ending the gold standard. During the gold standard, the dollar bill was a certificate of deposit of gold which was redeemable to the bearer on demand. Post-gold standard, the dollar bill is pure paper money, what the academics call fiat money. Read my previous article The Gold Standard.
One immediate consequence was that the government could now issue money at will. And indeed, since 1975, the US has increased the money supply tenfold. As you can see from the chart below, the money printing accelerated in 2009, after the Great Recession. With this level of money printing, we actually need a lot of cheap imports to keep inflation at bay or else there would be too much money chasing too few goods.
The Trade Deficit: Who Is The Winner?
Share this:

The Gold Standard
Posted on: July 12, 2019
|
Share this:

The Trade War May Be Here To Stay
Posted on: June 3, 2019

The trade deal between the US and China fell through a few weeks ago. Since then, I’ve read at least three versions of what happened, ranging from Trump applying maximum pressure, to Xi reneging, to Xi wanting to do the deal but not being able to get the politburo to go along. Wall Street is hoping Trump and Xi, who will be meeting at the G20 a month from now, can magically salvage the deal. Based on what I’ve read in Chinese media, I am a lot less hopeful. Prior to Trump’s last-minute maximum pressure surprise, I saw the state media was preparing people for a deal; after that, it was preparing people for a long fight.
Bloomberg recently published a study of the economic impact of tariff escalation (see chart below.) As you know, I generally don’t react to the news, but this is looking like a structural change to the world economy that may warrant a reduction in risk exposure. If you are worried, feel free to schedule a time with me to talk about it: http://calendly.com/mzhuang/15min.
Share this:

 The recent market volatility reminds me of an ancient Greek historian, Thucydides. He wrote “The History of Peloponnesian War,” about the war between the then reigning power Sparta and rising power Athen. He famously wrote: “What made war inevitable was the growth of Athenian power and the fear which this caused in Sparta.”
Fast forward to two thousand five hundred years later. A Harvard University political scientist, Professor Graham Allison coins the term “The Thucydides Trap” to describe the power dynamic between the reigning power and the rising power. Through an extensive study of historical precedents, he found there are sixteen cases where a major nation’s rise has disrupted a dominant one. Twelve of these ended in wars. For example, the rapid industrialization of Germany rattled Great Britain’s established position at the top of the pecking order, leading to the first World War.
In his book “Destined For War: Can America and China Escape the Thucydides Trap?” Allison argues that this historical metaphor is the best lens through which to observe the US-China relationship.
Share this:

 As of yesterday’s closing bell, the Nasdaq Composite is already in correction territory, down more than 12% from its high. However, the other two indices have yet to reach the correction stage, which is marked by a drop of at least 10%: the Dow is down 8.4% while the S&P 500 9.4%.
I am going to look at the recent market drop from two perspectives: statistical and economical.
Looking through the lens of statistics, a correction is long overdue. Why? Well, the historical odds of a correction are once every two years, those of a bear market once every five years. Yet the last time we had a correction was in 2011, seven years ago. Is it well-overdue?
Looking through the lens of economics, there are two exogenous economic forces that are influencing the market. One is the Trump tax cut, the other is the Trump trade war. These two forces are driving the market in opposite directions.
Share this:

In my last newsletter I discussed the profitability premium. It, along with the small cap premium and value premium, form the three established directions whereby investors can improve their expected returns on their stock investments.
To be more specific, to improve expected returns, an investor should tilt their portfolio towards profitable companies, small cap stocks and value stocks.
However, one must keep in mind that return premiums are not certainties. There will be periods, sometimes rather extended periods, during which:
- Small cap stocks underperform large cap stocks
- Value stock underperform growth stocks and
- Profitable stocks underperform unprofitable stocks
Share this:

Early on the morning of May 13, President Trump tweeted:
“President Xi of China, and I, are working together to give massive Chinese phone company, ZTE, a way to get back into business, fast. Too many jobs in China lost. Commerce Department has been instructed to get it done!”
What?!?!?! Trump wants to save Chinese jobs? To say that I am caught by surprise is an understatement.
Let me give you a little background just in case you don’t pay attention to the news (God Bless You!)
When ZTE was caught selling telecom equipment to Iran and North Korea in 2016, they entered into a plea agreement with the US commerce department (Obama administration) that included the following stipulations:
-
They will pay a $1.19 billion fine, the largest fine ever paid by a company.
-
They will fire the four executives involved.
-
They will discipline the 35 employees involved.
Fast forward to May 2018, just before the US trade delegation headed over to Beijing for negotiations, the US commerce department announced a 7-year ban on component exports to ZTE because they did not carry out the third stipulation of the plea agreement. It turns out the 35 employees were not disciplined, they were given their 2016 year-end bonus!
Share this:

 In 1971, Nixon ended the gold standard and since then the US has been consistently running a trade deficit. The US has not gotten poorer but instead has benefited tremendously from trade deficits.
Prior to that time, foreign holders of dollars could redeem the money in gold and ship it out of the country, resulting in the loss of national wealth. That’s why prior to 1971, the US generally had a trade surplus.
After the ending of the gold standard, the US dollar became a fiat money that can theoretically be printed at will. When the trade deficit with China was $350 billion last year, what it actually meant was that China sent us $350 billion worth of goods, and we gave them our printed paper(fiat money dollar) in exchange. The USA is the only country that can do that because the dollar is the world currency! I suspect China is secretly envious of our position. Read the rest of this entry »
Share this:

Trade War Started. What Do We Do?
Posted on: March 26, 2018
 Let’s start with some basic facts. As of 2017, the US imports goods worth about $550 billion from China, while only exporting about $175 billion to China. The trade imbalance is about $375 billion in China’s favor. President Trump believes China is making off with $375 billion of the US’s money every year and he is out to stop that. He announced tariffs on $60 billion worth of Chinese goods yesterday, mostly targeting high-tech imports from China.
The biggest high-tech import item from China is … round of applause …the iPhone, totalling about $70 billion a year since China is the final assembly place of all iPhones using parts from Japan, Korea, Taiwan, the US and China.
If an iPhone sells for $1000 in the US, it is counted as $1000 worth of Chinese imports, but 60% of all its economic value is captured by Apple. China probably captures less than 10% of the economic value. The rest is shared primarily by Japan, Korea, Taiwan. A tariff on the iPhone will harm Apple more than China, and also hurt Japan, Korea and Taiwan along the way.
Share this:

When the PE10 is over 29 …
Posted on: April 5, 2017
The US market ended the month of March with the PE10 at 29.02. The PE10 is a stock market measurement devised by Nobel Prize winner Robert Shiller to measure the extent of market over-valuation or under-valuation. The long-term mean of the PE10 is 17, so the current level is nearly twice the long-term mean.
There have been only two other instances in history when the PE10 was this high, one in July, 1929 and one in February, 1997. It’s very interesting to study these two instances to frame our expectations of future market returns.

In the 1929 instance, the market peaked two months later while in the 1997 instance, Read the rest of this entry »
Share this:

Don’t Panic If This Happens
Posted on: January 16, 2017
 Since the election, the US stock market has been breaking new highs, encouraged by the prospect of lower taxes and higher growth. However I believe investors have not paid sufficient attention to the prospect of a trade war.
To a large extent, the election of Donald Trump is a repudiation of globalization by a large segment of the US electorate. Even though the country as a whole has benefited tremendously from globalization, those benefits have by and large bypassed working-class folks.
Before 2000, Apple made all of its computers in the US and its market cap never rose about 10 billion dollars. Since then, Apple has subcontracted all of its production overseas and only kept design and marketing in US soil. The result?
Apple has become the most valuable company in the world with a market cap of over $600 billion even though they only have 66,000 employees in the US.
At the same time, Apple’s contract manufacturer Foxconn directly employs over 1 million workers in China. The supply chain to Foxconn employs another two million people. Read the rest of this entry »
Share this:


At the end of June this year, UK citizens voted in a referendum for the nation to withdraw from the European Union. The result, which defied the expectations of many, led to market volatility as participants weighed possible consequences.
Journalists responded by using the results to craft dramatic headlines and stories. The Washington Post said the vote had “escalated the risk of global recession, plunged financial markets into free fall, and tested the strength of safeguards since the last downturn seven years ago.” The Financial Times said “Brexit” had the makings of a global crisis. “[This]represents a wider threat to the global economy and the broader international political system,” the paper said. “The consequences will be felt across the world.”
What about those self-proclaimed financial gurus? Motley Fool wrote: “Sell Everything! How Brexit Can Shatter Share Market” and Jim Cramer wrote: “Don’t Buy! Why the Mass Brexit Sell Off is Worth Riding Out.”
It turned out there was no “mass brexit sell off.”
It’s true UK got a new Prime Minister, and the Pound Sterling fell to 35 years low. But within a few weeks of the UK vote, Britain’s top share index, the FTSE 100, hit 11-month highs. By mid-July, the US S&P 500 and Dow Read the rest of this entry »
Share this:

 Recently, I did a long horizon return study based on 100 years of stock market data and inflation from 1916 to 2015.
The study assumes a 20-year investment horizon. If your primary reason for investment is for retirement security, this is the horizon that should apply.
In the study, I looked at rolling 20-year stock returns, inflations and (after inflation) real stock returns. I present the results in the table below. The first and second columns are the beginning and ending years of the 20- year period. The third column shows the nominal growth of $1 invested in S&P 500 in the corresponding period. The fourth column shows the shrinkage of $1 due to inflation in the corresponding period. The fifth column shows the real (after inflation) growth of $1 invested in S&P 500.
-
During the last 100 years, inflation (cash is losing value) is the norm, while deflation (cash is getting more valuable) only occurs during the Great Depression.
-
In the 20-year span that has the worst inflation (between 1968 and 1987,) cash loses 71% of its value.In the medium case, cash loses 45% of its value in 20 years.
-
During the last 100 years, stocks always make money in any given 20-year period. Even in the worst 20 years (between 1929 and 1948) which includes the Great Depression, you get $1.95 for $1 invested in stocks. (If you use my dividend strategy, you could do a lot better.)
- In the medium scenario, stocks give you 4 times real return; In the best scenario, stocks give you 10 times real ret Read the rest of this entry »
Share this:

It seems every other d ay or so, another shoe drops in China that sends the world market into tailspin. What the heck is going on there?
In 2008, the US was hit by the worst financial crisis since the Great Depression. Between 2008 and 2013, US industrial production contracted about 5%, Japan and Europe did even worse, they were down more than 10%. But China’s industrial production more than doubled during those five years. By 2013, it was 30% larger than that of the US.
What give? Alas there was a stimulus package in China (with borrowed and printed money) to build high speed rails, airports, metros, ports, and more than a few ghost towns. This infrastructure building binge created a massive but artificial demand, while growing government debt to 280% of GDP.
For a time, it was almost magical. China was growing by 10% while other countries were in recession and China was credited with saving the world economy.
But this growth model is not sustainable: there are only so many ghost towns you can build before running out of ghosts. So starting about 3 years ago, China scrambled to find a new growth model that is based on domestic consumer demand (as opposed to export,) services (as opposed to manufacturing,) innovations and entrepreneurship (as opposed to government command and control.) Read the rest of this entry »

