Repost: Calendar Anchoring and Stock Market Seasonality
Posted on: September 16, 2021
This is an article I wrote fourteen years ago that was inspired by Daniel Kahneman’s Nobel Lecture “Maps of Bounded Rationality.” Here I will repost it without changing one word – I am proud of the evergreen nature of my articles. At the end, I will make a few additional comments in red that include new insights from the last fourteen years.
Do you know that the top three one-day drops in Dow Jones happened in October? On the 19th of October 1987, Dow Jones fell nearly 23%, making the day the worst day in the US stock market history. It was followed by the 24th and 29th of October 1929, when Dow Jones fell 13.5% and 11.5% respectively, ushering in the Great Depression. These events are commonly remembered as the crash of 29 and the crash of 87.
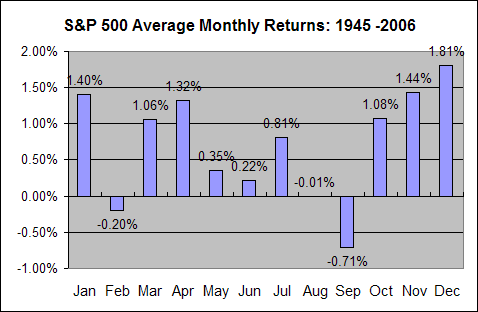
Despite boasting the top three worst days in the market history, October is not the worst month for the stock market. That distinction belongs to September. (See Chart) In fact, summer (from June to mid October) is usually the most volatile and least productive season for stocks. Economists can not quite account for it, but this seasonality is very persistent. So much so that there is a Wall Street folklore that says “buy in November and sell in May”.
The title of my June Newsletter is “Stock Market Seasonality “. This is a good starting point to understand the “What” of this topic. In this article however, I will attempt to discuss the “Why” of stock market seasonality through the prism of Nobel Laureate Daniel Kahneman’s behavioral theories.
Information Accessibility
Some information is more accessible to human minds than others. For instance, visual images are more accessible to human minds than statistics. Deers kill approximately 600 times more people in the US than alligators. Yet if you ask people which of the two animals is more dangerous, nearly all would pick the alligator. Why so? Because alligators look more dangerous and the Chinese say: ”An image is worth a thousand words.”
In the case of those big stock market crashes, the most accessible information to ordinary investors is the calendar information – in October they happened. The reasons, the dynamics and the consequences of the crashes are simply quite difficult to comprehend. Take the crash of 87 for example, dynamic hedging and program trading were the culprit. Because the crash was not triggered by economic fundamentals, the market recovered very quickly. The teaching of dynamic hedging belongs to the PhD curriculum. It is just too difficult for ordinary investors to understand.
Anchoring
In the words of Kahneman and Tversky, “people rely on a limited number of heuristic principles which reduce the complex task of accessing probability and predicting values to simpler judgments.” One of the heuristic principles is anchoring, which is relying on the most salient or accessible information, rightly or wrongly. In the case of the crashes, the most salient and accessible information is that they all happened in October, and ordinary investors may intuitively judge that to be the plausible cause of the crashes. More thoughtful investors may suspect that these crashes happening in October is a mere coincidence, and they may mentally attempt to correct the initial intuitive judgment. According to Kahneman and Tversky, however, “the correction is likely to be insufficient, and the final judgment is likely to remain anchored on the initial intuitive impression.”
Explanation of Stock Market Seasonality
The vast majority of investors may very well anchor their understanding of the crashes on the calendar and incorrectly judge October to be the month with a very high likelihood of another crash. To hedge this imagined risk, some of them may take their money out of the market entirely in September or earlier and just wait for October to pass, causing the market to go down in summer and in particular in September. The rest who keep their money in the market would become very vigilant and may tend to interpret information more negatively than it is, causing the market to be very volatile. After October however, money would return and vigilance would be replaced gradually by holiday spirits and we get our usual year-end rally.
New Insights
The data from the last fourteen years has manifested that this seasonality of the stock market has diminished a great deal. For instance, the average September return of the last fourteen years is 0.89%, no longer negative! Indeed the term “Black October” is rarely seen in the financial press anymore. I might even surmise the fact that the top three biggest crashes all happened in October is no longer salient in investors’ minds. Thus it no longer drives trading behaviors as much as it did before.
Schedule a 2nd opinion financial review, buy my wealth mgmt books on Amazon.
Get informed about wealth building, sign up for The Investment Scientist newsletter


Leave a comment