Archive for the ‘Economics & Markets’ Category
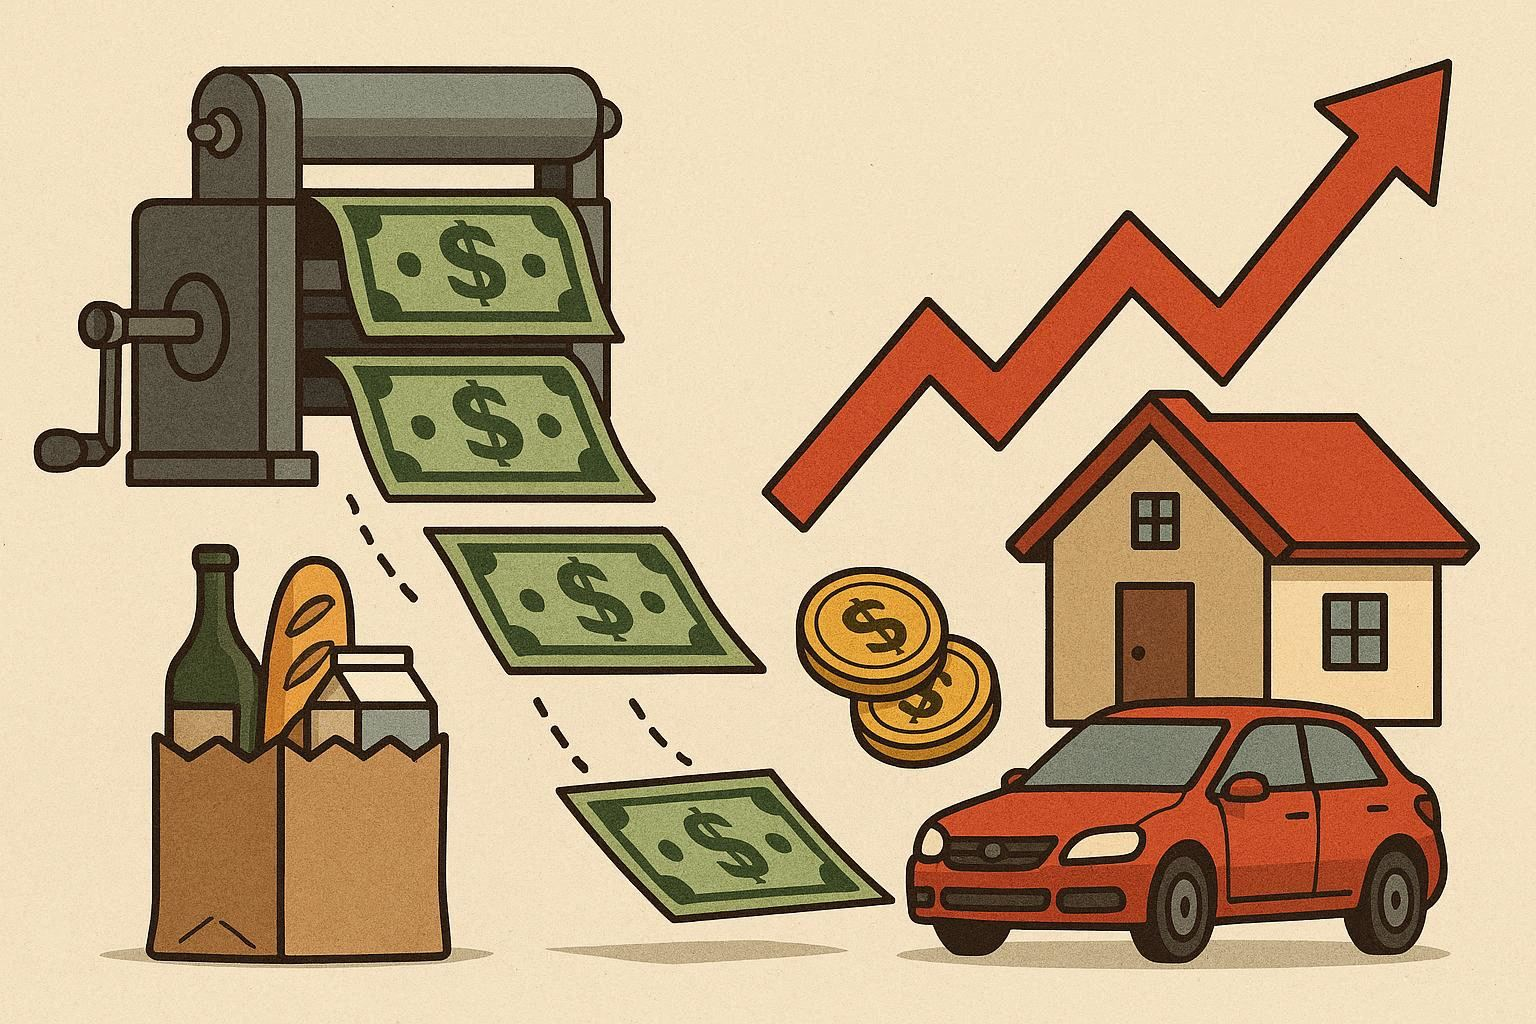
Money Neutrality is the economic concept that printing money only raises prices without raising wealth and overall economic well-being.
To explain this to my 14-year-old, I told a story about the Spanish colonization of South America. The colonizers found a lot of silver, which was a hard currency in medieval Europe. When they took a large amount of it back to Spain, the amount of silver in the country quadrupled. In terms of silver, Spain was four times wealthier, but were they four times better off?
Read the rest of this entry »Share this:

Yesterday, the price of gold dropped 10% in one day. Even with that decline, it is still up 12% this year and up 84% since the beginning of 2025. Today, I will write a bit about gold because I have built a small position for all of my clients since 2022, after the Russia-Ukraine conflict started.
Remember when the US and EU froze Russia’s foreign reserves? That move, which was intended to hit Russia hard, sent a chill through central banks everywhere, especially in the Global South. Until then, the US dollar had served as a reserve asset in many sovereign central banks, meaning that they needed to acquire US dollars before they could issue their own currencies.
The Great Dollar Diversification
Read the rest of this entry »Share this:

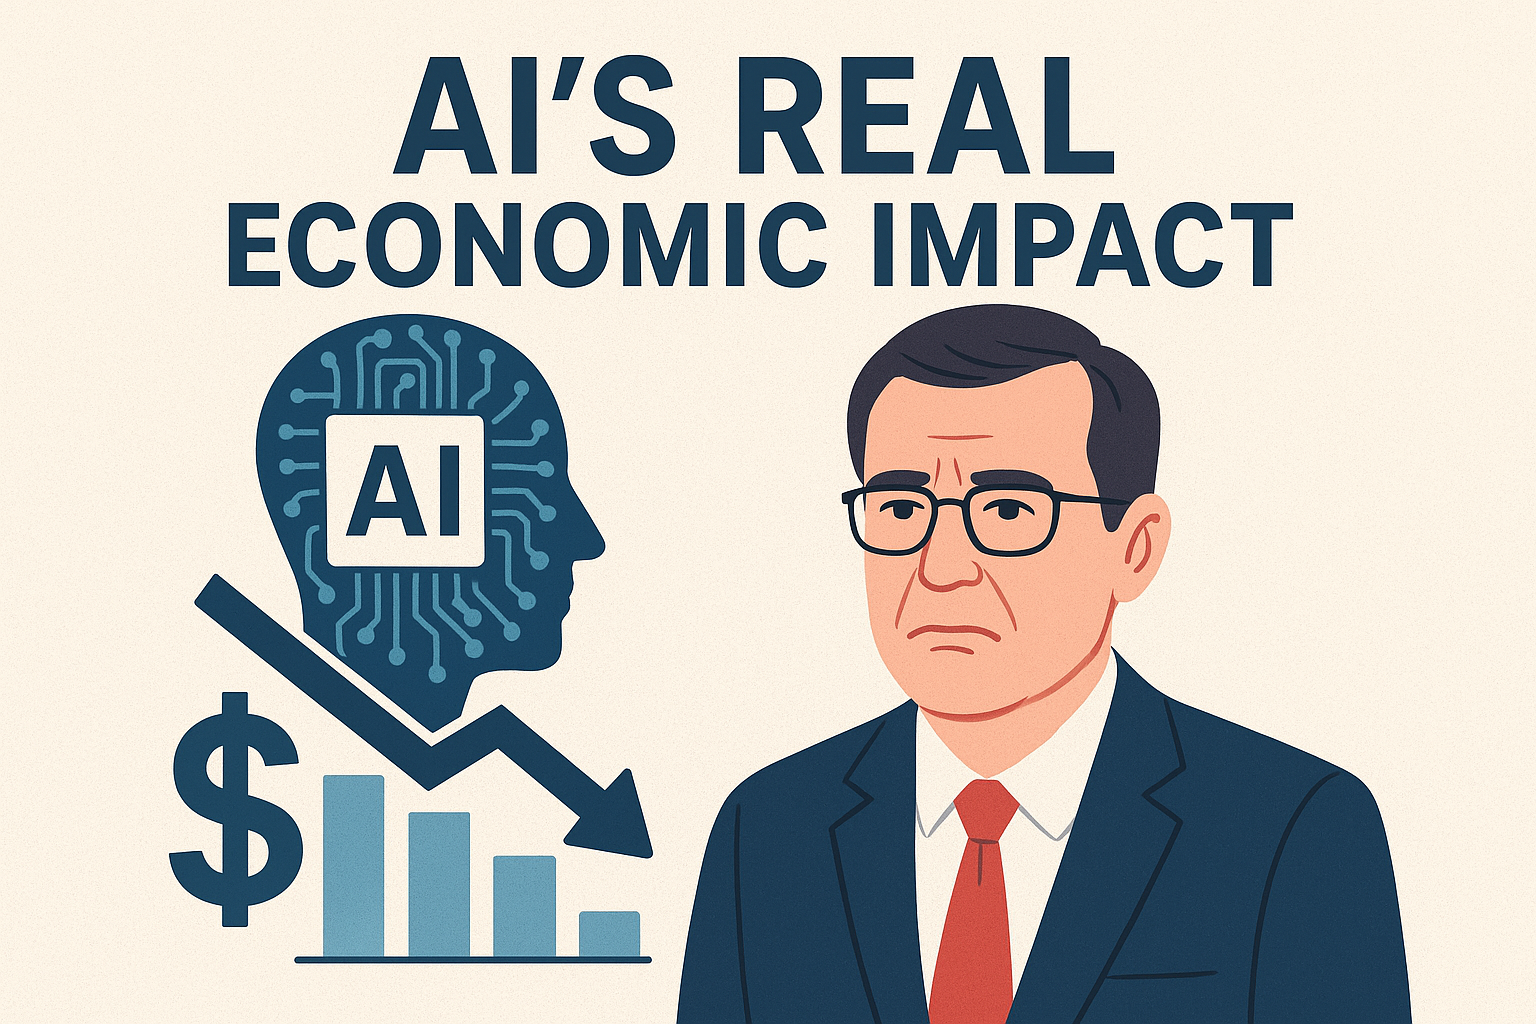
Today I am writing about a paper by MIT professor and 2024 Economic Nobel Laureate Daron Acemoglu titled “The Simple Macroeconomics of AI”.
Unlike the bullish projections of AI’s transformative impact on economics, Acemoglu’s view is much more measured. Given the overwhelming media coverage favoring maximalist views on AI, his perspective offers a necessary counterpoint.
Acemoglu argues that over the next ten years, AI will likely automate only 5% of tasks and increase the GDP by about 1%. He explains that while AI excels in specific tasks with clear truths, most real-world jobs involve complex, tacit, contextual knowledge and social intelligence that AI can not easily replicate and replace.
His paper also makes these important points:
Read the rest of this entry »Share this:


The “GENIUS Act,” officially known as the Guilding and Establishing National Innovation in U.S. Stablecoins Act, represents a significant shift in the financial landscape. This legislation allows private entities, including banks, hedge funds, and technology firms, to issue payment US dollar stablecoins. This opens up a new frontier for financial transactions and investment opportunities.
What Are Payment US Dollar Stablecoins?
Payment US dollar stablecoins are cryptocurrencies designed to maintain a 1:1 value with the U.S. dollar. They are intended to facilitate seamless transactions with the stability of a traditional fiat currency.
Who is Eligible to Issue US Dollar Stablecoins?
Qualified issuers include subsidiaries of banks and nonbank companies that receive approval from the Office of the Comptroller of the Currency (OCC). A critical requirement for approval is maintaining a reserve that covers 100% of the stablecoin issuance. This reserve can consist of actual U.S. dollars or short-term Treasury bills with a maturity of less than 90 days.
Existing USD Stablecoins
The market already features several USD stablecoins. Tether’s USDT and Circle’s USDC are the two largest, with a combined market value of approximately $250 billion. The daily transaction volume of USD stablecoins exceeds $20 billion, primarily within the cryptocurrency ecosystem.
Intended Purposes of the Legislation
Read the rest of this entry »Share this:

Triffin’s Dilemma: The Privilege and The Curse of the Dollar As World Currency
Posted on: March 28, 2025
Following our series about academic research, today I will write about Triffin’s Dilemma, a theory proposed by Dutch economist Robert Triffin in the 1960s.
The theory postulates that the country that owns the world’s reserve currency will inevitably face a persistent trade deficit that will imperil the confidence in that currency.
The theory was originally tied to the Bretton Woods Accord after World War II, where the US dollar was pegged to gold, and the rest of the world’s were pegged to the dollar. In 1971, President Nixon announced the de-pegging of the dollar from gold, effectively, making the dollar a fiat currency that the government could “print” as much of as they wanted.
This is an exorbitant privilege that other countries do not enjoy. By this, I mean that no matter what problems our country faces, we can print our way out of trouble. The oversupply of the dollar would normally cause hyperinflation in our country, but since ours is the world currency, we can export our surplus dollars to the rest of the world by running a trade deficit.
Exporting dollars is a great business to have, since instead of goods, which requires costly manufacturing, dollars can be created by simply adding an entry into the Fed’s computer system. However, a side effect is, that nobody wants to invest in manufacturing and no young people want to work in factories. All smart kids want to be in finance, the industry that is closely related to money creation, allocation, and management. This has led to overfinancialization and the gradual deindustrialization of the country (See chart below.)
Read the rest of this entry »Share this:


What has happened in the last few days was a mad dash out of the door of all US dollar-dominated assets to buy back Japanese Yen. Why so? I have to start by explaining the Yen carry trade.
For a long time, Japan’s Central Bank has maintained an extremely low interest rate policy of between 0% and 0.1%. If you were smart money with the right access, what would you have done to earn effortless money? You would borrow Japanese Yen and convert it to US dollars. By just investing the money in US treasuries, you could immediately earn more than 5%. This is called the Yen carry trade, essentially an arbitrage of the interest rate differentials of the US and the Japanese Central banks.
In any event, the result of the Yen carry trade has been the almost endless depreciation of the Japanese Yen, the appreciation of the US dollar, and an endless supply of additional liquidity to the US stock market despite the Fed’s tight money policy. This additional liquidity pushed up all manner of asset prices. But alas, all good trade has to come to an end.
Read the rest of this entry »Share this:

Last week I published a newsletter article titled “Will The Stock Market Return to The Fundamental?” I have received a good number of responses, and as promised, today I will share my thoughts.
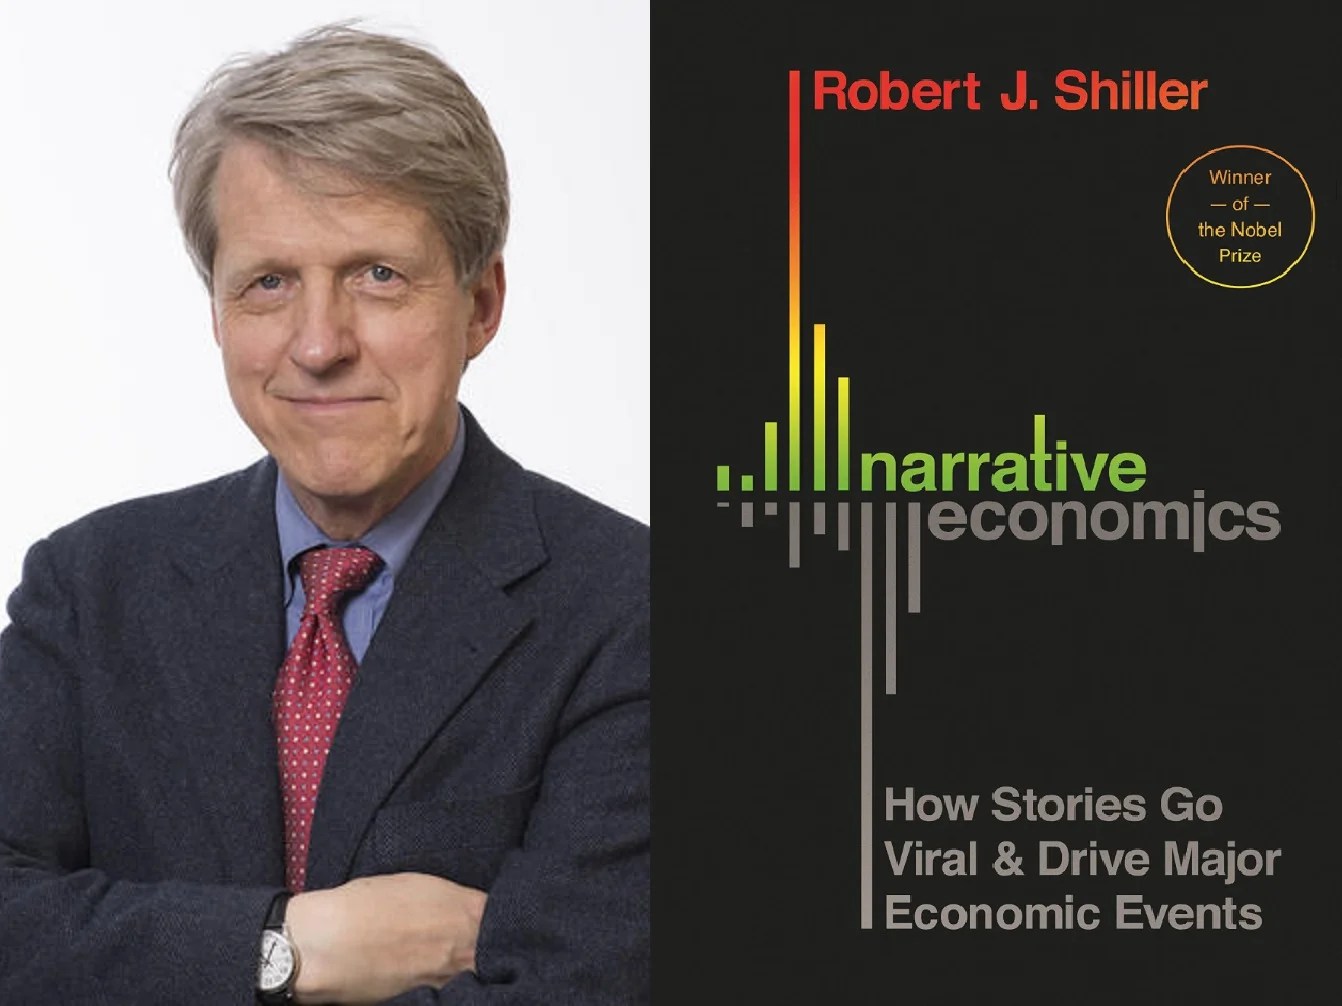
The traditional economic theory has always presumed that economic actors are calculating and rational. The application of this presumption in the investment field is the efficient market hypothesis, which basically says that investors rationally pay the prices for expected future earnings adjusted for risk. The biggest proponent of the efficient market hypothesis is Nobel Prize winner Eugene Fama.
The efficient market hypothesis has its biggest opponent in Robert Shiller, who years ago published his seminal work that illustrated how a 1% change in dividends can oftentimes result in a 15% change in the stock price. If investors are, in fact, calculating and rational, stock prices shouldn’t fluctuate so much relative to dividends.
Read the rest of this entry »Share this:

America’s national debt is spiraling out of control. It’s at $34.4T right now and is increasing at a rate of $2T per year. Today I am going to prognosticate what will likely happen and what it will mean for us investors.
To make the projection, I will assume things will stay largely as they are:
- Inflation around 4%
- Interest rate about 5%
- Budge deficit around at $2T
At this rate, in five years, the total federal debt will be over $44T. At an average interest rate of 5%, the total interest payments in the federal budget will be $2.2T. In 2023, the total federal tax revenue came at only $4.6T. In other words, in five years or so, the interest payments alone will amount to nearly half of the federal tax revenue.
With a budgetary shortfall at that level, there will be no other option but to “print’ more dollars. Today I will not discuss the mechanism of printing money. Suffice to say that printing money will lead to inflation and inflation necessitates that the Fed keeps the Fed fund rate high.
Read the rest of this entry »Share this:

In this article, I want to show how, in the last 15 years, the Fed’s money supply has driven stock prices higher and higher and how this situation going to reverse.
Prior to the 2008 financial crisis, the Fed kept the money in circulation in the economy relatively steady, just under $1T. Then the 2008 recession hit and to save the economy, the Fed began to “print” money. This action is given various lofty names like Quantitative Easing and Balance Sheet Expansion. The end result, however, was the same, about $1T was released into the economy. This is illustrated in spot (1) in the chart below.

Share this:

A Federal Budgetary Hell?
Posted on: October 4, 2023
Two weeks ago, I wrote about the retirement income nirvana that is allowing retirees to finally get some serious income from their savings, starting with Treasury bills. The money that goes into retirees’ pockets has to come from somewhere, so let’s look at this chart produced by the Saint Louis Fed.
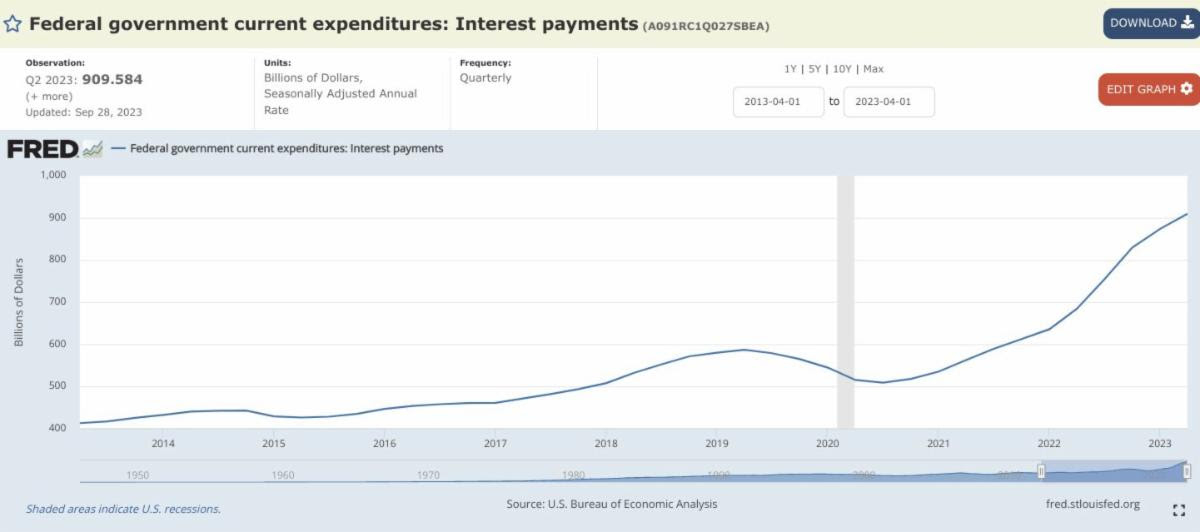
It shows the interest payments the federal government has made every year up to 2023. One can see that, ten years ago, the interest payments came to about $400 Billion. Today, it’s over $900 Billion! Now, it’s true that some of these payments are to other government agencies like the Social Security trust fund or the Medicare trust fund. Even after adjusting for that, the NET interest payments by the federal government rose from about $225b in 2014 to $700b in 2023.
The federal budget is a trainwreck waiting to happen – a disaster that would make the current government shutdown drama look like child’s play.
In 2023, the actual federal revenue is $4.3 Trillion, but the federal expenditures total $6.2 Trillion, resulting in a budget deficit of nearly $2 Trillion. Since the government is short of this money, they have to borrow it.
How does the government spend money?
Read the rest of this entry »Share this:

A Retirement Income Nirvana!
Posted on: September 27, 2023
Barely a year and a half ago, the Fed fund rate for overnight lending stood at (annualized) 0.08%. Now it is between 5.25% and 5.50%.
This has tremendous positive implications for retirees who need a steady fixed income. Imagine that you are someone who has accumulated $1mm for retirement. If you didn’t want to take any risks and you invested your entire nest egg in the Fed fund (not that this is even possible), you would have a grand total of $800 a year! That’s why a year and a half ago, I had to expose my clients’ money to stock market risk, duration risk and interest rate risk just to earn some real returns.
Then the Fed realized that inflation was out of control, and geopolitically the US needed to defend against de-dollarization, so since the middle of 2022, it has driven the Fed fund rate up. At the current upper rate of 5.5%, a $1mm investment will earn one $55,000 in totally safe interest income. $55,000 vs $800 – that is quite a difference! Who would have thought fighting inflation would be a blessing for retirees on fixed incomes?
Read the rest of this entry »Share this:

Stock market sentiment refers to the overall sentiment of investors towards the stock market. This sentiment can be either positive or negative, indicating whether investors are optimistic or pessimistic about the future direction of the market.
There is a lot of evidence that stock market sentiment is a contrarian indicator of future market returns. Let me cite a few recent examples.
- When Covid hit the US in March of 2020, the entire market was gripped with fear and there was panic selling. Since then, however, the market has nearly doubled.
- In February of 2022 when the Ukraine War broke out, European markets also experienced panic selling. It was rumored that billions upon billions of dollars were moved from Europe to invest in the US market. Who would have thought that by the end of 2022, European markets would have higher returns than the US market?
- In March of this year, the US experienced two of the largest bank collapses in history. Some of my clients sent me doomsday articles and asked me if they should pull all their money out of the market just to be safe. Since then, the market has gone up around 20%.
In fact, this phenomenon has been rigorously studied. The chart below details the research results of Harvard Professor of Business Administration Malcolm Baker and NY University Nomura Professor of Finance Jeffrey Wurgler. Here you can see that across all market capitalizations (that is regardless of large stocks or small stocks) the negative sentiment leads to better subsequent one-year returns than the positive sentiment.
Read the rest of this entry »Share this:


In this article, I will not discuss the Credit Suisse collapse and rescue that just happened less than ten hours ago, since I don’t understand the Swiss banking system as well as I understand the US system. Here in the United States, we have had a rapid succession of specialty bank collapses: Silvergate Bank, Silicon Valley Bank (SVB) and Signature Bank. Most of their depositors are super wealthy people or businesses whose deposits amount to much more than the 250k guaranteed by the FDIC. The majority of American banks do not have that kind of customer profile and the majority of American depositors have less than $250k in their bank accounts. Does that make the rest of the banks in America safe? I am afraid not.
Though the depositor profiles may be different, all banks invest in the same “safe” government or government-backed debt securities, and all banks have unrecognized losses in those securities. By some estimates, the entire US banking system has $660B in unrecognized losses.
Read the rest of this entry »Share this:

During 2020 and 2021, the Fed printed $5T to combat a potential economic collapse caused by Covid 19. Some of this newly minted money found its way into Silicon Valley Bank (SVB) deposits. Since the short-term interest rate at that time was essentially at zero, SVB invested a large portion of the money into long-maturity mortgage-backed securities (MBS) that at the time were at least yielding somewhere around 1.6%.

If we look at the SVB Balance Sheet, this investment is classified as Held-to-maturity securities on the asset side (shown in green.) This means if they hold the securities until maturity, they will definitely not lose money. But if they are forced to sell before maturity in a rising rate environment, they will lose money.
Read the rest of this entry »Share this:

The following is a chart I grabbed from the St. Louis Federal Reserve website. It more or less explains why we are experiencing runaway inflation now, and why it may not easily go away.
The chart shows the total M1 money supply. Note that as recently as 2012, the total money supply was just over $2T, but now, only ten years later, it is over $20T. That’s a ten-fold increase. The majority of this increase came during the Pandemic when within a few short months, the money supply increased from $4T to 16T.
Only after March of this year, when it became clear that inflation is not “transitory,” did that money supply begin to taper off slightly. It does not look like it will ever go back to the level it was at prior to 2020, though.

Share this:

Since the beginning of this year, the stock market has experienced its worst six months in the last 50 years. At one point, the Nasdaq was down 30%, and the Dow and the S&P 500 were in bear market territory. From its lowest point, the market has recovered a bit, but after Chairman Powell’s Jackson Hole speech, the market seems to have resumed its slide. So the question is, will the market give us even deeper discounts on stocks?
Before we go into that, let me sum up my impression of Chairman Powell’s Jackson Hole speech. He has found his inner Paul Volcker! He has turned from a super dove to a super hawk when it comes to inflation.
Read the rest of this entry »
