Fed Actions: Expect less from Stocks?
Posted on: October 12, 2023
In this article, I want to show how, in the last 15 years, the Fed’s money supply has driven stock prices higher and higher and how this situation going to reverse.
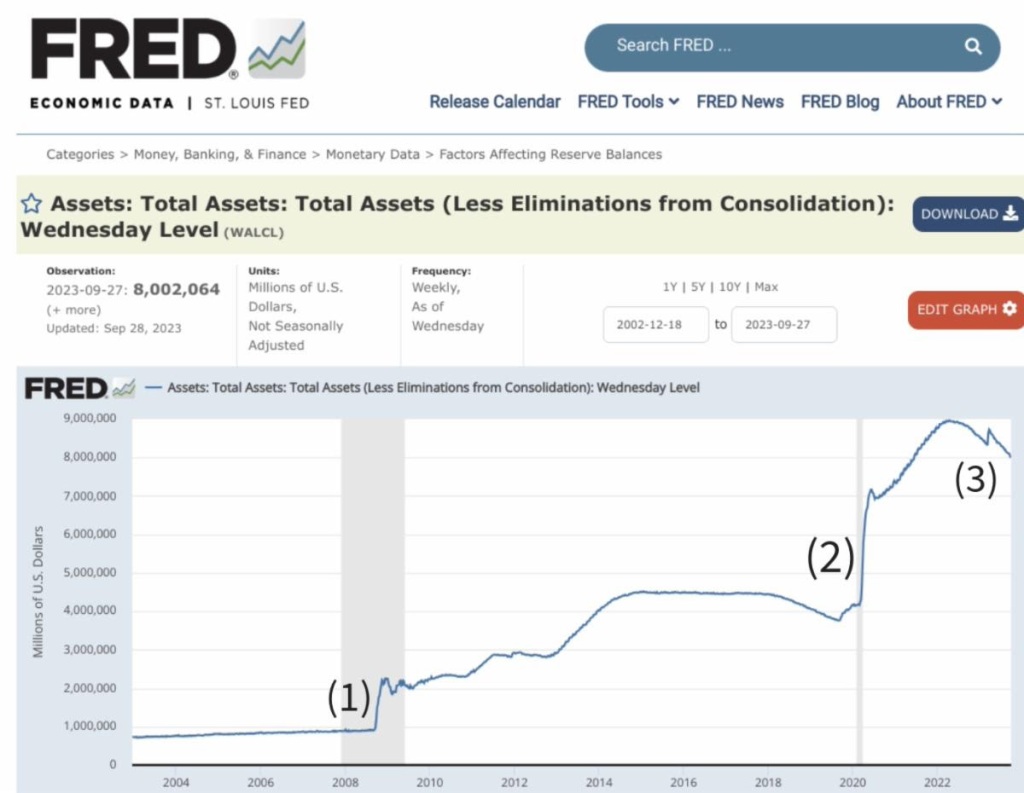
Prior to the 2008 financial crisis, the Fed kept the money in circulation in the economy relatively steady, just under $1T. Then the 2008 recession hit and to save the economy, the Fed began to “print” money. This action is given various lofty names like Quantitative Easing and Balance Sheet Expansion. The end result, however, was the same, about $1T was released into the economy. This is illustrated in spot (1) in the chart below.

At first, the Fed was worried about inflation, but that did not occur. For one thing, China was churning out cheap goods left and right to export to the US. For another, international trade was expanding, and the world needed more dollars to undergird this trade expansion. The combined effect was that inflation was muted even after all that money was created.
After they discovered this magic formula, the Fed (and the politicians) became bolder. You can see that from 2009 to 2020, the money supply crept up from $2T to $4T. Then the pandemic came, and in one fell swoop, the Fed created another $5T, and the total money supply peaked at $9T, See (2) in the chart. This time, however, inflation did follow.
In the 12 years from 2009 and 2021, the amount of money in circulation increased by a factor of 9. During the same period, stock prices increased by a factor of 6. If we look at just the last few years, from 2000 to 2001, the money in circulation doubled, and so have stock prices. I’d like to argue that the stock market performance is, to a large extent, driven by the Fed’s money supply actions.
However, since the middle of 2022, due to the need to rein in inflation, the Fed began to “unprint” money, again using hard-to-understand terms like Quantitative Tightening, Balance sheet Reduction, etc. So far the Fed has reduced the money in circulation by $1T or 11%. See (3) in the chart. The Fed’s stated goal is to reduce the money supply by 30%, or $2.7T.
Compared to the recent peak of the market, the S&P 500 has dropped about 10%, closely tracking the Fed’s money supply. The question is: when the Fed really carries out the 30% reduction in money supply, how will that affect stock prices?
Of course, a lot of factors are in play as well, wars in Europe and the Middle East, and with deglobalization and de-dollarization, many dollars will come back to the US. ‘The money in circulation in the domestic economy may not reduce as drastically as the Fed has planned. That said, I do think we should temper our outlook for stocks for the next few years. What do you think? I’d love to hear your thoughts on this.
Get informed about wealth building, sign up for The Investment Scientist newsletter

Leave a comment