Posts Tagged ‘Stock Market’

A client of mine asked me this question and I thought many of my readers might have the same question.
What Happened to the Dot-com Bubble?
When the dot-com bubble popped in March of 2000, the Nasdaq lost nearly 80% of its value over a two-year bear market stretch, and it took 15 years, that is, until 2015, for the Nasdaq to regain its previous high. As you can imagine, that was financially devastating for investors fully invested in the Nasdaq.
Are We in a Similar Bubble, Only Now Driven by AI?
It’s highly likely. As I write now, NVDIA’s market cap is over $5T. In other words, a company with + 36,000 employees is now valued higher than the entire GDP of Japan, an advanced country with a population of 140 million. If that’s not a sign of a bubble, what is?
Will It Pop Like the Dot-com Bubble and Wipe Out 80% of Its Value?
Read the rest of this entry »Share this:


The title of this article comes from a recent discussion I had with a client of mine. First, we should define what “the fundamental” means. It is best defined in Intelligent Investor, a book by Warren Buffet’s teacher Benjamin Graham. In short, his idea of a good investment is a stock with good earnings selling at a cheap price.
Graham’s insights were lately confirmed by Eugene Fama’s Nobel Prize-winning research, where Fama found that throughout history (until maybe 2015,) small-cap value stocks performed the best.
At present, the stock market in the US is definitely not following Ben Graham’s fundamentals. 70% of all returns are concentrated in the seven biggest tech stocks, all of which are very expensive. Nvidia for example, has a $3T valuation, which is 4 times the GDP of Taiwan, where its AI chips are made.
Read the rest of this entry »Share this:

I asked you all this question yesterday, and today I will share select replies followed by my comments on the matter.
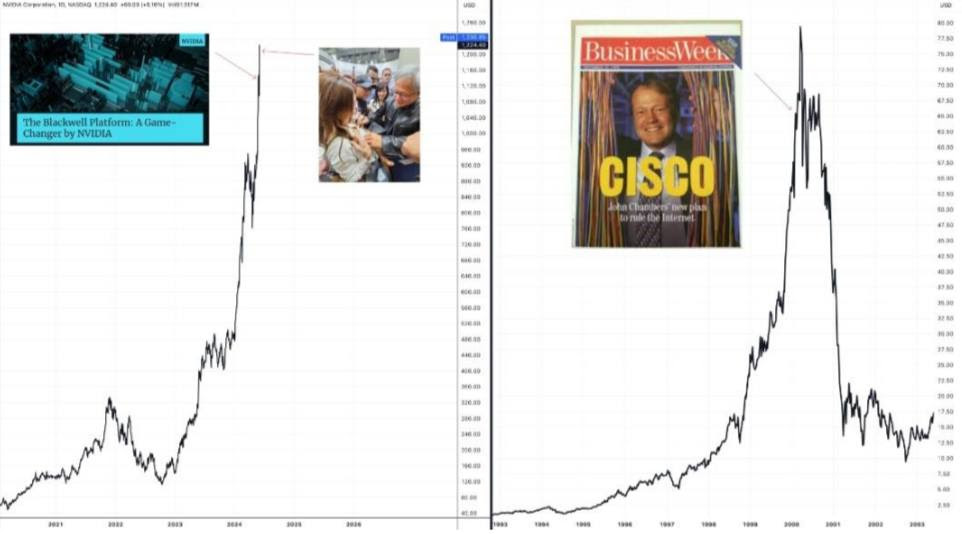
JG wrote: The joy ride will eventually end. The current price dictates an annual revenue growth of 10 percent per year for the next 100 years. This isn’t happening. Ultimately, the dream will fade, and many will lose their money.
JG also shared the chart below. What CSCO was for the internet age, NVDA is for the AI age, namely, an infrastructure provider. This picture is indeed worth a thousand words.
Share this:

 2013 has been a stellar year for stocks. As of today, the S&P 500 is up more than 25%. There are about ten trading days left and barring unforeseen circumstance, the index will end the year in the 20+% range.
A few of my clients are concerned; with the market doing so well this year, what does that bode for 2014? Well, I don’t have a crystal ball, so all I can do is to look at historical data to make an imperfect reference.
To answer the question, I asked my intern Nahae Kim to do a study of the relationship of immediately subsequent year returns. Specifically, can one year return predict the next year?
Firm | Youtube | Facebook | Twitter | LinkedIn | Newsletter
Share this:

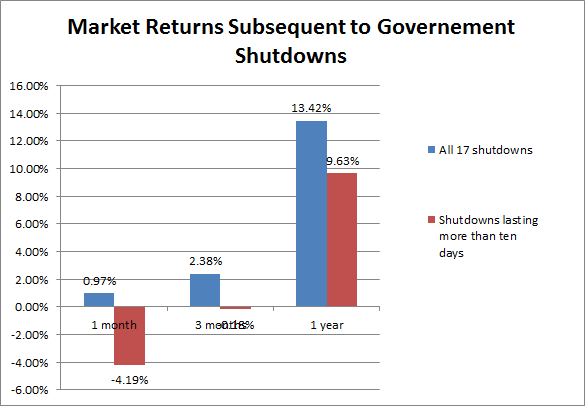
Using the closing price prior to the day of government shutdown as a base line, he found on average, the market rose 0.97% in one month, 2.38% in three months and 13.42% in a year.
If we isolate the 5 most severe shutdowns that lasted more than 10 days, the picture is a bit worse, but not by much. On average the market fell 4.19% in one month, fell .18% in three months and rose 9.63% in a year.
These historical precedents confirm my gut feeling that a government shutdown is really no big deal, as far as the market is concerned.
More worrisome is the upcoming debt ceiling fight. There is no precedent of US default to guide my outlook on this, but the longer the government shutdown lasts, the deeper heels get dug in by both parties and the more likely a default. Nevertheless, I’m still thinking that will also be a storm in a tea cup.
The bottom line is these are issues beyond our control, there is no point worrying about them. If worst comes to worst (ie default,) and the market should drop 20%. That’s actually great because then we can buy shares at a discount!
Share this:

 1. ThinkAdvisor highlighted a Maryland study which showed that states which pay the highest fees to Wall Street (for managing pensions) have the lowest returns. That says it all about Wall Street. No wonder Rick Ferri wants you to steer clear of actively managed funds.
2. Reuters Money reported how Health Savings Accounts (HSAs) can be used as retirement savings accounts. This information is especially useful for small business owners and self-employed individuals who tend to neglect their retirement savings and face high deductibility in their health insurance. Here is the garden variety of ways they can save for retirement.
3. DIY Investor Robert Wasilewski encountered a bear while hiking. He survived to write about it, but he mused that the same reactions that kept him in the gene pool will surely “eliminate you from the investment pool.”
Firm | Youtube | Facebook | Twitter | LinkedIn | Newsletter
Share this:

Crises and opportunities
Posted on: August 13, 2012

Is Refinancing Right for You?
Do you see any evidence of superior investment strategy for the last five years? Seems all is correlated and all is going nowhere.
This is a question I got from a reader of my newsletter.
I hate to be impolite, but I think he is focusing on the wrong thing. Yes indeed, over the last five years, the market has given us one disappointment after another – first the financial crisis in the US and now Europe.
There is a silver lining in all of these crises, though. Mortgage rates are at an all-time low. Five years ago today, the 30-year mortgage rate was 6.75%; now it is 3.5%. If you have a $400k mortgage on your house, do you know how much you save if you refinance?
Share this:


US Stock Market Returns
What an indelible mark on many investors’ psyche the financial crisis in 2008 has left! Despite two years of strong equity returns, many investors are still on the sideline, afraid even to dip their toes into the market.
That’s understandable. Most investors’ perspectives are shaped by their most recent experiences. They are now doing things they wish they had done prior to the economy’s plunge into crisis. But does this make sense now that we are recovering?
Share this:

Deficits, Debt and Market Returns
Posted on: March 10, 2011
[Adapted from Brian Harris of Dimensional Fund Advisors] As government spending hits record levels (see chart below) around the globe, some politicians, economists, and pundits are warning that rising indebtedness may drag down economies and financial markets. If you are concerned, you are not alone. I heard that over and over from my clients. So how does public debt affect economic growth and market returns? The evidence might surprise you. Let’s explore these issues by addressing a few popular questions about sovereign debt: So how does public debt affect economic growth and market returns? The evidence might surprise you. Let’s explore these issues by addressing a few popular questions about sovereign debt:
Read the rest of this entry » |
Share this:


Recession Stock Market
Three years ago, at the onset of the recession, I performed research analyzing the previous nine recessions after WWII and wrote an article “Recession and Stock Market Performance” based on that research.
Given that I am not clairvoyant – unlike many market pundits and some fellow financial advisors – I can’t see the future. I can only use my research of the past to frame my perspective of the future.
I came away with two conclusions:
Share this:

 Who are we? That’s the question many financial advisors have been asking themselves. I agree with Carl Richards when he says financial advisors have an identity crisis. Are we looking in the mirror each morning wondering who we are? Maybe not, but we do have a problem.
Let’s Confuse ‘Em
There are many so-called “financial advisors” that simply want to sell clients expensive products; and one of the ways to do that is to confuse the customer. Now, financial firms don’t actually have an official Customer Confusion Department, but they might as well have one. Case in point: We call ourselves “fee-only” advisors, hoping to differentiate from product pushers on commission; pretty soon, they re-brand themselves as “fee-based” advisors. How many people can actually tell the difference between a “fee-only” advisor and a “fee-based” one?
Share this:

Out of curiosity, I took the S&P 500 annual return data since 1926, calculated the index’s moving 10-year returns and produced the chart below. Two things are worth noting:
1. The 10 years ending 2008 are the worst ever for the index, with a total return of -13%.
2. The S&P 500’s 10-year return dynamic seems to follow a periodic pattern. The second worst 10-year period ended in 1938 (-9%); and the third worst 10-year period ended in 1974 (13%), almost right in the middle of 1938 and 2008. Serendipity?
The market is in a trough. A chart can not predict the future, but if it can, things can only get better from here.

S&P 500 10-year return dynamic
Get my white paper: The Informed Investor: 5 Key Concepts for Financial Success.
Get informed about wealth building, sign up for The Investment Scientist newsletter
Share this:

- In: Uncategorized
- Leave a Comment
July 2008 marks the start of a bear market after all major market indices have fallen more than 20% from their most recently peaks. This article is part two of my three-part research on bear markets. In part one, I researched how long a typical bear market lasts?. In this installment I ask this question:
Which style fared the best in a one-year time frame after stocks have entered a bear market?
There are four primary styles of stock investing: Small Cap Value (SV), Small Cap Growth (SG), Large Cap Value (LV), and Large Cap Growth (LG). Typically, before stocks enter into a bear market, Small Cap stocks, regardless of value or growth, get hit the hardest.
Using data provided by Fama/French benchmark style portfolios, I calculated one-year returns of the four investment styles from the month stocks entered a bear market. The results are tabulated below.
Sign up for my monthly newsletter to get the full article.
