Posts Tagged ‘S&P 500’
Typical Salesman’s Chart for EIA
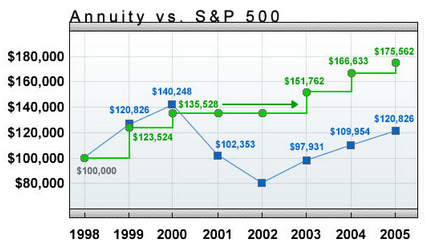
Financial author Allan Roth once wrote an article called “Investment Trick – Annuity Style” where he asks a rhetorical question, “If the S&P 500’s total return is 12% in a given year, what do you think your equity index annuity (that is supposed to track the S&P 500) would return”?
- 10%
- 8%
- 5.4%
- 3.4%
Allan Roth goes on to explain why the correct answer is 3.4%. Boy, was he wrong! Read the rest of this entry »
Share this:


New York Stock Exchange
Recently, I got a call from a physician client of mine who asked a fantastic question. The Shiller PE of the S&P 500 index is at 24 now, much higher than the historical mean of 16 – is the market headed for a fall?
What is the Shiller PE?
This is a stock market metric invented by Yale Professor Robert Shiller. Basically, it is the average of the PE ratios of ten consecutive years. Because of that, Shiller PE is also called PE10.
Professor Shiller found it to be a reasonably good measure of valuation of the whole market: the higher the Shiller PE, the more expensive the market.
Back to my client’s question, I told him right away that I don’t know the answer. I don’t make investment decision based on opinion. I have to research historical data. After I hung up the phone, I asked my assistant to study the relationship between the Shiller PE and forward one-year and forward three-year returns.
Share this:

New York Stock Exchange
The S&P 500 closed the first quarter at a record high. Should that worry investors? The short answer is, No.
When the market was 30% below the high three years ago, I did some research. I categorized all market conditions into:
1. Breaking a new high.
2. Less than 10% below historical high.
3. Between 10% and 20% below historical high.
4. Between 20% and 30% below historical high.
5. Between 30% and 40% below historical high.
6. More than 40% below historical high.
Then I calculated the one year forward returns of the six conditions.
Share this:


House for sale
Recently, a client called to tell me that he had finally got the big boulder off his back, and it was such a relief for him.
The “big boulder” he referred to was his big house, with a swimming pool and a tennis court. The house had been costing him $100k a year in property taxes and upkeep, more than 50% of my client’s retirement income. No wonder he called it a big boulder on his back.
He bought the house 25 years ago for $2.2mm, and he just sold it for $2.1mm. After all the costs associated with selling the house, he took home $2mm and change.
Share this:


Recession Stock Market
Three years ago, at the onset of the recession, I performed research analyzing the previous nine recessions after WWII and wrote an article “Recession and Stock Market Performance” based on that research.
Given that I am not clairvoyant – unlike many market pundits and some fellow financial advisors – I can’t see the future. I can only use my research of the past to frame my perspective of the future.
I came away with two conclusions:
Share this:

Beyond the S&P 500
Posted on: November 4, 2009
 If you are like most investors, your equity portfolio will have a few auspiciously named stock funds and a few company stocks you feel comfortable with. You think you are well-diversified, but you really are only investing in the universe of the S&P 500 – the largest 500 stocks of the US equity market.
Share this:

“The recession is very likely over.” – Fed Chairman Bernanke on 9/15/09.
What does the fed chairman’s statement mean for stocks, if indeed the worst recession since 1929 is over? We don’t know for sure. We can, however, let history be our guide.
In this spirit, I studied the one-year and three-year returns of the S&P 500 Index and the Fama/French Small Cap Value Index coming out of a recession for the nine recessions since 1950.
Share this:

Out of curiosity, I took the S&P 500 annual return data since 1926, calculated the index’s moving 10-year returns and produced the chart below. Two things are worth noting:
1. The 10 years ending 2008 are the worst ever for the index, with a total return of -13%.
2. The S&P 500’s 10-year return dynamic seems to follow a periodic pattern. The second worst 10-year period ended in 1938 (-9%); and the third worst 10-year period ended in 1974 (13%), almost right in the middle of 1938 and 2008. Serendipity?
The market is in a trough. A chart can not predict the future, but if it can, things can only get better from here.

S&P 500 10-year return dynamic
Get my white paper: The Informed Investor: 5 Key Concepts for Financial Success.
Get informed about wealth building, sign up for The Investment Scientist newsletter
Share this:

Bear market: how long will it last?
Posted on: July 30, 2008
It’s official. On July 9, US stocks slid more than 20% from their October high, sending the S&P 500 into bear market territory. Even earlier this month the NASDQ and Dow Jones turned bearish following the Russell 2000, an index of small caps, which lead the decline.
How long will this bear market last?
Well, I don’t have a crystal ball, but I do have a rear view mirror.
Since 1960, there have been ten bear markets (see Table). The worst bear market took one-and-a-half years to reach bottom. Four reached bottom within a month. The remaining five hit bottom between one and ten months. On average, it took 4 months to reach bottom.
| Date of entering bear market | Months to bear bottom | 1 year return from entry | 3 year return from entry |
| 2/26/2001 | 19 months | -11% | -8% |
| 10/8/1998 | < 1 months | 38% | 12% |
| 10/17/1990 | < 1 months | 33% | 59% |
| 10/19/1987 | 2 months | 3% | 13% |
| 3/1/1982 | 5 months | 34% | 63% |
| 3/6/1978 | < 1 months | 13% | 49% |
| 12/10/1973 | 10 months | -32% | 9% |
| 1/26/1970 | 4 months | 10% | 35% |
| 10/3/1966 | < 1 months | 28% | 24% |
| 5/28/1962 | 1 month | 20% | 51% |
| Average | 4 months | 14% | 31% |
Data source: Moneycentral.com
Now that we are in a bear market, shall we move to cash?
I don’t recommend it. Here’s why. From the day the S&P 500 entered a bear market, on average it returned 14% in one year and 31% in three years.
Let’s look at the distribution of returns. This is important. Among the ten one-year returns, two were negative, yet three were over 30%. As for the three-year returns, only one was negative but three were over 50%!
I don’t know about you, but I like those odds.
Get informed about wealth building, sign up for The Investment Scientist newsletter
