University endowments are important institutions. They play a critical role in maintaining the academic excellence of the universities that rely heavily on their income. Recently, these endowments have drawn much attention because of their superior investment returns compared to other institution investors, such as investment banks and insurance companies.
There is much diversity among university endowments. Ivy League endowments such as those of Yale and Harvard are well ahead of the pack in terms of investment returns.
Share this:

Jim Cramer: “Watch TV, Get Rich!”
If you watch his show, you certainly would not forget the Top Ten predictions he made in January 2nd, 2008. Now that we are well into 2009, it’s about time to check the accuracy of his predictions.
On Goldman Sachs (GS)
Goldman Sachs (GS) makes more money than every other brokerage firm in New York combined and finishes the year at $300 a share. Not a prediction—an inevitability. In fact, it’s only January, and I think it’s already come true.
GS lost 59.06% last year, 22% more than the S&P 500 Index.
On oil and Transocean (RIG)
Oil goes much higher, maybe as much as $125 a barrel… We are running out of oil more quickly than people can imagine, and that means great returns for oil companies. Just buy the stock of the company you filled up at today or buy a driller (Transocean (RIG) is my favorite), then sit back and make money.
RIG lost a total of 67.64% last year, 29% more than the S&P 500 Index.
On Arabic bailout of Citigroup (C)
The Fed arranges an Arabic Heimlich maneuver on Citigroup (C), so the banking giant doesn’t choke on the worst mortgage portfolio in the country.
Share this:

Jon Stewart takes Jim Cramer apart
Posted on: March 14, 2009
- In: Uncategorized
- Leave a Comment
On the after-effect of government bailout
This debilitating spiral has spurred our government to take massive action. In poker terms, the Treasury and the Fed have gone “all in.” Economic medicine that was previously meted out by the cupful has recently been dispensed by the barrel. These once-unthinkable dosages will almost certainly bring on unwelcome aftereffects. Their precise nature is anyone’s guess, though one likely consequence is an onslaught of inflation. Moreover, major industries have become dependent on Federal assistance, and they will be followed by cities and states bearing mind-boggling requests. Weaning these entities from the public teat will be a political challenge. They won’t leave willingly.
On government bailout
Whatever the downsides may be, strong and immediate action by government was essential last year if the financial system was to avoid a total breakdown. Had that occurred, the consequences for every area of our economy would have been cataclysmic. Like it or not, the inhabitants of Wall Street, Main Street and the various Side Streets of America were all in the same boat.
On his own mistake
… But there’s another less pleasant reality: During 2008 I did some dumb things in investments. I made at least one major mistake of commission and several lesser ones that also hurt. I will tell you more about these later. Furthermore, I made some errors of omission, sucking my thumb when new facts came in that should have caused me to re-examine my thinking and promptly take action.
Share this:

“Avoid the fee-ing frenzy,” says David Swensen. 
Marion banks at Wachovia. When she needs to rollover her 401(k) into an IRA account, she naturally asks a Wachovia financial advisor for help. He helps her open an account and recommends she buy the Evergreen Asset Allocation Fund (EAAFX). Is there anything wrong with this picture? Plenty!
First, the fund has a sales charge (front-end load) of 5.75%. Her 401(k) balance is $100,000. This means, the advisor takes $5,750 just for the act of opening the account for her.
Share this:

The financial crisis has sparked a debate about the Yale model, that it doesn’t work as advertised in the current market condition. Here is David Swensen‘s response in an interview with Seth Hettena, Special to ProPublica.
The first thing I’d say is it’s too short a time period over which to judge. If you want to have a fair assessment of any investment strategy, get through the crisis and then look back and see how things performed.
If you look back 10 years from June 30, 2008, Yale’s performance was 16.3 percent per annum. Bonds were 5 percent plus or minus, and stocks were 3 percent plus or minus. So what are you going to do? You’re going to give up that kind of performance to hold a lot of bonds to protect against the financial crisis? Where’s the alternative that performs so much better? 100 percent government bonds? Is that the alternative? Well, then what would have happened if you had held that the decade before? I don’t get it.
They’re not thinking about what happened the 10 years before and they’re not giving us time to get through this crisis and see how it plays out for the Yale model against a more traditional portfolio. That’s one of the really interesting things in these articles that have been critical of the Yale model and sometimes of me personally: Where’s the alternative? What’s the option? Yeah, the model fails. Well, relative to what?
Here is the source.
Get informed about wealth building, sign up for The Investment Scientist newsletter
Share this:
Yale Endowment asset classes
Posted on: February 6, 2009
Once upon a time, the Yale University Endowment invested like the rest of us, in just two asset classes: US equity and fixed income. After taking over the reins in 1987, David Swensen, the chief investment officer of Yale Endowment, moved aggressively into non-traditional and often illiquid asset classes like foreign equity, absolute return, real assets and private equity.
Chart: The Yale Model asset allocation
![[enable picture display to see this chart]](https://i0.wp.com/www.thedividendguyblog.com/wp-content/themes/leia-en/imagenes/2008/03/yale-asset-allocation.gif)
Picture credit: thedividendguyblog.com
His unconventional approach produced a 20-year unbroken record of positive returns, resulting in stellar growth of the endowment from $1b to $17b. No wonder rival school Harvard University studies him closely. Other institutional money managers trip over themselves trying to mimic him.
Yale’s six asset classes are defined by their different expected response to economic conditions, such as inflation, growth and interest rate. Here is my own simplified explanation and cautionary note about these asset classes in relation to us as individual investors.
Absolute Return is a class of investment that seeks to generate long-term returns not correlated with the market.It does this by exploiting market inefficiencies. There are two basic strategies: event-driven and value driven. Event driven strategies rely on specific corporate events such as mergers, spin-offs or bankruptcy restructuring. Value driven strategies rely on buying under-valued assets while at the same time short-selling over-value assets. Don’t try this at home! You might just be the inefficiency being exploited.
Private Equity is a class of investment that participates in leverage-buyout (“LBO”) and venture capital. Venture capital is money that funded Google. However, it also funded thousands of failed ventures. LBO partnerships engage in the exercise of buying badly run businesses, reforming them, and then reselling them for a profit. Good private equity funds are generally close to individual investors. However, many below-average funds (often with exorbitant fees) are being aggressively marketed by Merrill Lynch and the like to unsuspecting high-net-worth individuals.
Real Assets include real estate and commodities. They are tangible (as opposed to paper assets) and they’re a good hedge to inflationary forces. This asset class is accessible to individual investors through Exchange Traded Funds (ETFs) and physical property such as the houses they live in.
Fixed Income is an asset class that produces a stable flow of income. It provides greater certainty than other asset classes. Fixed-income investments will perform badly in an inflationary environment, with the exception of treasury inflation protected bonds or TIPS. This asset class is readily accessible to individual investors.
Foreign Equity includes both matured market equity and emerging market equity. With US economy becoming an ever smaller slice of the global pie. This asset class provides a great way to participate in foreign growth. However, their diversification benefit is over-rated. With the exception of China, foreign stock markets highly correlate with the US market. Foreign equity is very accessible to individual investors.
Domestic Equity needs no additional explanation.
By all mean let David Swensen enlighten you, but don’t fall all over yourself trying to mimic him. What is good for Yale is not necessarily good for you. This is an advice coming from none other than Swensen himself.
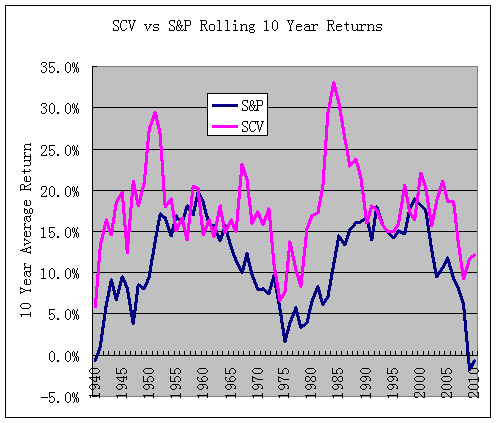
Many investors are puzzled by the underperformance of small cap value since May of this year. They ask: “Is it worth being in an asset class that can’t do well in bad times?”
To answer their question, I did a 10-year rolling return comparison between the Fama/French Small Cap Value (SCV) and the S&P 500 index using data from 1931 to 2010. The first 10-year period is 1931 to 1940, the second is 1932 to 1941, and the last is 2001 to 2010. Here is the rolling return chart I got.
Share this:

It was reported a few days ago that Merrill Lynch lost a staggering $15.3 billion in 2008. That did not prevent their senior executives to pay themselves $4 billion bonus. In the words of John Thain, CEO of Merrill Lynch, that’s what it takes to keep the talents.
Continue to read how to avoid hidden fees by the like of Merrill Lynch financial advisors.
Share this:
A David Swensen lecture on asset allocation, security selection and market timing
Posted on: February 3, 2009
David Swensen, Yale’s Chief Investment Officer and manager of the University’s endowment, discusses the tactics and tools that Yale and other endowments use to create long-term, positive investment returns. He emphasizes the importance of asset allocation and diversification and the limited effects of market timing and security selection.
Share this:
This is based on an interview David Swensen done on Fox News Network.

David Swensen
1. Have a strong decision-marking process
Investing success requires sticking with decisions made uncomfortable by the variance of opinions. In his own words:
Think carefully how it is that you are gonna allocate your assets and stick with it. Too many individuals were excited about the equity market 18 months ago and were despairing 3 months ago. It should have been the other way around. They should have been concerned about valuation 18 months ago and excited about the opportunity to put money to work at lower prices 3 months ago.
2. Sell mania-induced excess, buy despair-driven value
On his favorite area of despair-driven value, David Swensen has this to say:
I think the most interesting area is the credit market. Bank loans are trading at extraordinary low value. High-grade corporate debts, below investment grade corporate debts associated with companies that are gonna survive this are extraordinarily cheap. It’s not the only place to find value, but that would be the top of my list.
3. Make decision based on thorough analysis
Know where you belong …
There are two ends of the continuum in the investment market. You should be in one extreme or the other. There is no room for success in the middle. At one end of the spectrum, you get investors who committed resources to do high quality jobs in active management … At the other end of the continuum are purely passive investment vehicles – index funds. The vast majority of players are in the middle and the vast majority of players end up failing. Be at one end or the other and almost all investors belong to the passive end.
4. Watch out for the “fee-ing frenzy“
This one should be obvious but ignored by many investors.

Get my white paper: The Informed Investor: 5 Key Concepts for Financial Success.
Get informed about wealth building, sign up for The Investment Scientist newsletter
Share this:

In January 2008, I wrote in my article “Recession and stock market performance” that:
Small cap value stocks are likely to outperform.
With one week left in 2008, the Russell 2000 Value Index, representing small-cap value stocks, has lost 34%. This is bad, but not as bad as the S&P 500 Index’s 41% loss and the Nasdaq 100’s 43% loss this year. The S&P 500 Index represents the largest 500 stocks in the U.S. and the Nasdaq 100 represents the largest 100 growth stocks.
Since January, I’ve heard pundits recommending large-cap stocks, tech stocks, pharmaceutical stocks, etc. Never once have I heard them recommend small-cap value stocks, which they claim are the most vulnerable in a recession.
Do I have a better crystal ball?
No, I don’t. I simply know the odds. As I wrote in “Small-cap value underperforming: a historical perspective,” the odds that small-cap stocks will outperform large-cap growth stocks on aggregate in any given year is 75%. So I can make the same “prediction” year after year and still be right about 75% of the time.
Why do most investors shun small-cap value?
According to Daniel Kahneman, father of behavioral economics, certain types of information are more accessible than others to the human mind. For instance, the concept of probability is not intuitively accessible, but descriptive words like “small,” “large,” “value” and “growth” leave instant impressions on our minds.
Another discovery of Kahneman is that humans take mental shortcuts in decision making. Confronted with the choice between large-cap growth and small-cap value, most investors eschew the hard route of calculating odds. Instead, they rely on their intuition that “large” is safer than “small” and “growth” has more potential than “value.” Thus, they “decide” to shun small-cap value stocks.
Small-cap value premium
An undesirable job has to pay more to attract job-seekers. Likewise, a shunned asset class commands a higher expected return in equilibrium. As long as small-cap value is not an intuitively attractive asset class, this return premium will continue.
Get informed about wealth building, sign up for The Investment Scientist newsletter
Share this:
Yale’s Swensen in the press
Posted on: January 5, 2009
- In: Uncategorized
- Leave a Comment
David Swensen discusses the current state of the market and derivative trading >>>
Yale’s Swensen sees “Extraordinary” opportunity to snap up debts >>>
David Swensen discusses the ups and downs of Yale Endowment >>>
Jack Bogle, father of index funds, likes David Swensen and Warren Buffet >>>
Share this:
Boston Globe: “Harvard’s endowment plunges $8 billion”
WSJ: “Harvard hit by loss as crisis spreads to college”
Harvard Crimson: “Yale losses a quarter of its endowment”
Edward Eptein in The Huffington Post argues in “How much has Harvard really lost?” that Harvard endowment loss could be a lot higher than disclosed.
Check out how Harvard and Yale endowments performed prior to this fiscal year here. Note their fiscal year ends in June 30th.
Get informed about wealth building, sign up for The Investment Scientist newsletter
Share this:
Has the market hit bottom?
Posted on: December 9, 2008
“Successful investing,” in the words of British economist John Maynard Keynes, “is anticipating the anticipations of others.” In this vein, a market hits bottom when most people think that most other people think it has hit bottom. Only then, most people start to buy stocks, creating a self-fulfilling prophecy. If most people think the market should hit bottom, but they also think that most other people don’t think that, they won’t buy stocks and the market will continue to drop. So, predicting when a market will hit bottom is a mind game on a grand scale. If there are people who are good at that, I am certainly not one of them.
Prescience not needed, discipline required
Now let me ride a time machine to January 1929. Let’s say I committed to invest $100 every month in the S&P 500 index. I did not have the prescience to know that the market would crash in October and the Great Depression would follow. But if I had the discipline to carry out that investment plan over 30 years, the table below summarizes what would have happened to my investment through the worst stock market period in history.
| Year from Jan 1929 | Total invested | Portfolio value | Total dividend received | Total gain (loss) | Dividend contribution to the gain |
| 1st year | 1,300 | 1,115 | 23 | (161) | |
| 2nd year | 2,500 | 1,779 | 98 | (623) | |
| 3rd year | 3,700 | 1,737 | 230 | (1,734) | |
| 4th year | 4,900 | 2,771 | 415 | (1,714) | |
| 5th year | 6,100 | 5,547 | 629 | 76 | 100% |
| 10th year | 12,100 | 12,835 | 3,024 | 3,759 | 80.4% |
| 20th year | 24,100 | 30,786 | 13,683 | 20,369 | 67.2% |
| 30th year | 36,100 | 135,992 | 47,960 | 147,852 | 32.4% |
Data source: Professor Robert Shiller’s website
The total gain from my investment plan is the portfolio value plus total dividends received minus total money invested. As you can see, though I suffered losses in the first four years, I had a small gain in the fifth year (January 1934)! This result is not bad, considering that between1929 and 1934 were the worst years for the stock market (an 89% drop) in history.
For the first 10 years of my hypothetical investment, dividends accounted for 80.4% of the total investment gain. This means that if I had invested in high dividend stocks, I would have done even better. (Also see my newsletter article, “Dividends to the rescue in a Great Depression“.)
Here is the take-home lesson from my time travel experiment: to recover from the market crash and to survive a recession, however deep, you don’t need prophecy, just discipline and patience.
The author is president of MZ Capital, a RIA serving DC/MD/VA. Get his monthly newsletter in your mailbox or get to the directory of his past articles.
Share this:
I wrote this article in early December 2008. Amazingly, it is one of the least read in my blog. Had someone read it and followed it, he would have earned 10% return so far in 2009.
– Michael Zhuang 3/10/2009
At the moment of writing this, SPY, the exchange traded fund (ETF) for the S&P 500 index, is trading at $85.95 and the near at-the-money call option (with strike 86 and only eight days until expiration) is trading at $3.45! (A call option is the right to buy the underlying stock at the strike price. At-the-money means the option strike price is equal to the price of the underlying stock.)
The at-the-money call premium is a full 4% of the underlying index price! Historically, that number has been in the 1% to 2% range.
What does 4% premium imply?
Share this:

After the election of Barak Obama as our next president last night, I did an exercise to find out the historical stock market performance under a Democratic vs. Republican administration since 1900.
My examination showed that the view that a Democratic president is bad for the market is unfounded. In three important measurements: S&P 500 return, dividend growth and earning growth, stocks have done better under a Democrat administration.
However, the notion that a Democrat is bad for inflation does ring truth, as evident by the 4.8% inflation rate under a Democratic White House compared to the 2% under a Republican one.
| S&P 500 return | Dividend growth | Earning growth | Inflation | |
| Democrat | 8.1% | 5.6% | 10.6% | 4.8% |
| Republican | 6% | 5% | 5.7% | 2% |
Data source: Yale University Professor Robert Shiller’s database
My next exercise is to find out how the market performed during periods of Democratic control of both the White House and Congress. Sign up for my newsletter to get this information.

